This independent website celebrates hopeful and humane approaches to the energy transition, and embraces the insights of climate science.

IPCC Climate resilient development chart

Source: IPCC (2023) AR6 SYR SPM, Figure SPM.6 (modified)


The IPCC diagram above parallels today’s energy transition—going forwards, we could choose energy pathways that limit our exposure to increasingly volatile global supply chains and severe climate risks, while opening up new global opportunities in zero-carbon exports. We can do better than ‘business as usual’.

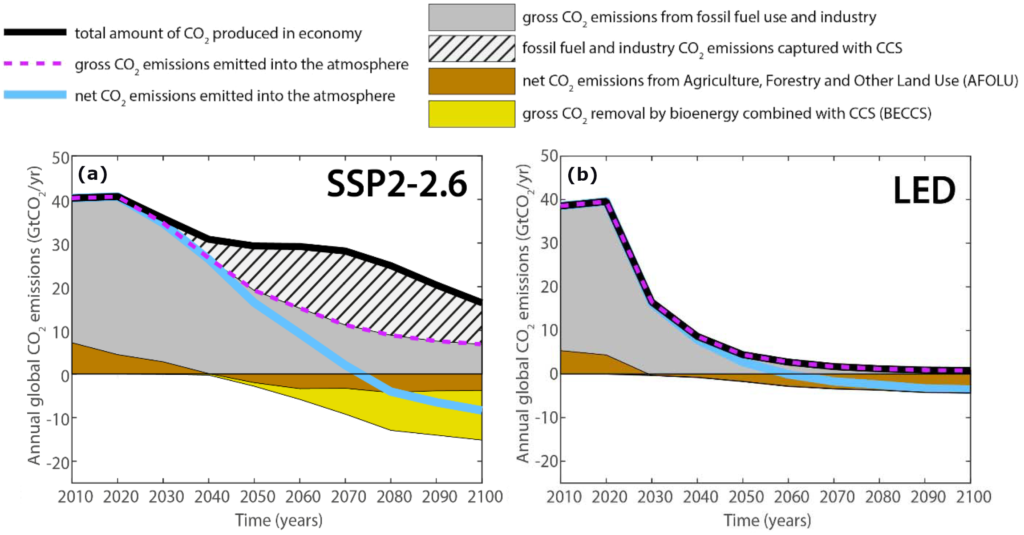
The IPCC diagrams in the Decarbonisation posts are easily accessible and highlight aspects of the challenge of avoiding dangerous climate change. Links to the relevant IPCC report chapters (and other articles) are provided at the bottom of each post.

Feel free to take a little time out to explore.