
Image: NASA International Space Station
[This is an early draft of an incomplete article. The figures and tables might be used later]
Table of Contents
Summary
This article provides a quick big-picture outline of some technical aspects of the global decarbonisation challenge this century:
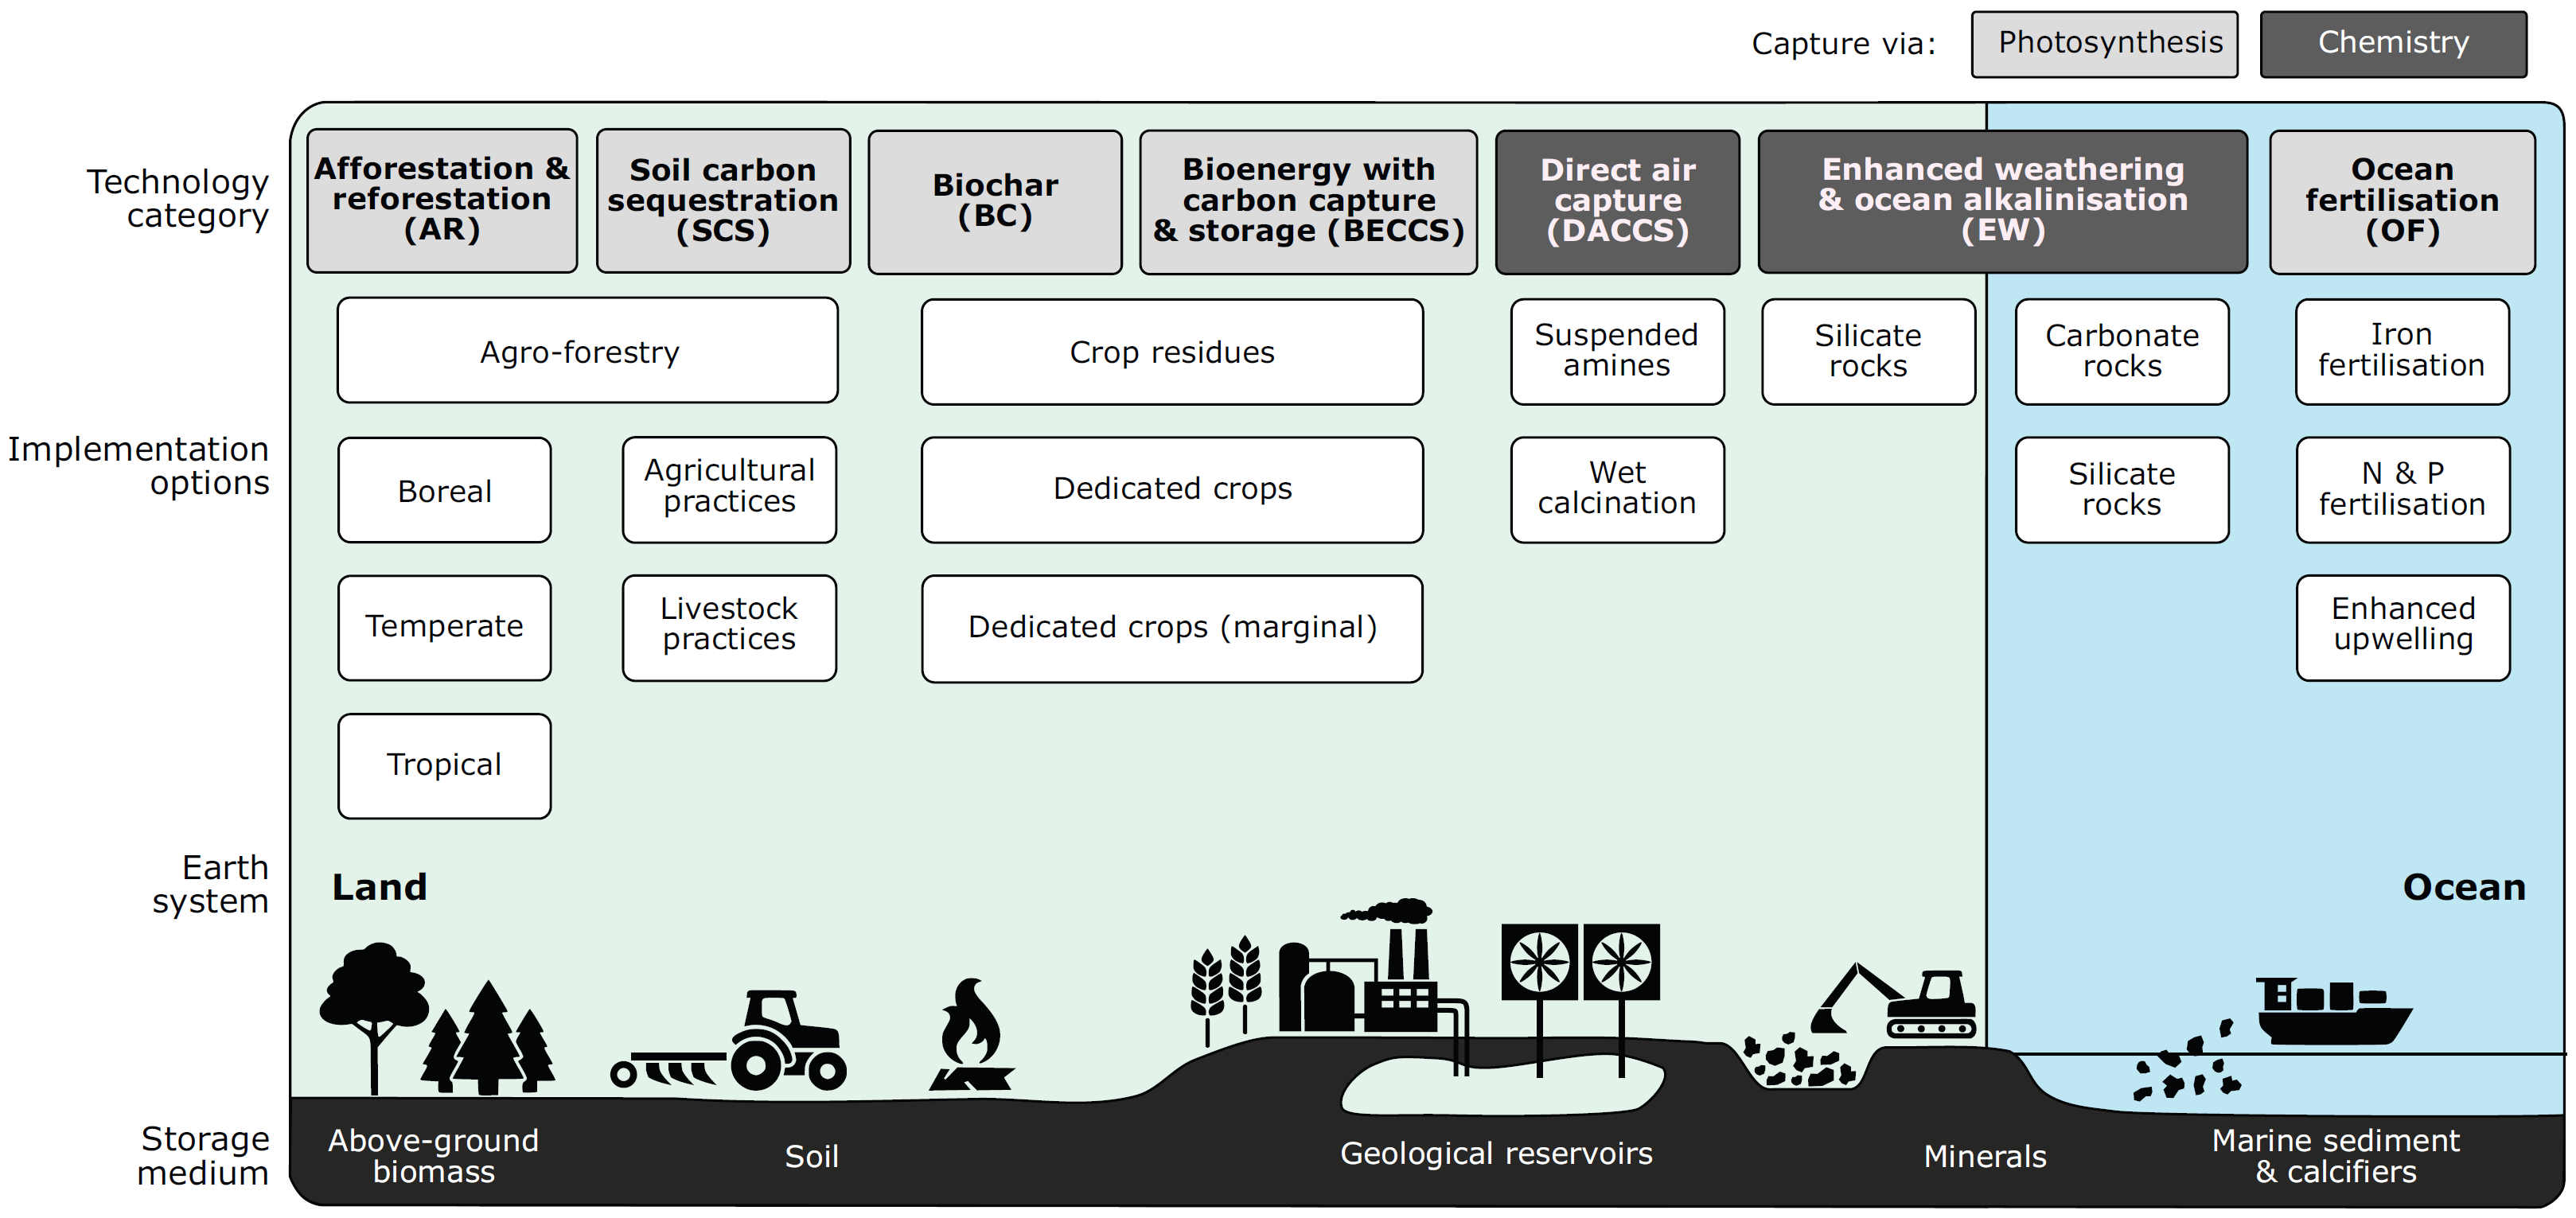
- Most global decarbonisation projections to the year 2100, that cover all of primary energy, make use of ‘negative emissions technologies’15 (or ‘carbon dioxide reduction’) to stay within carbon budgets that would conform to the 2015 Paris Agreement goals. But an over-reliance on the hope of future ‘negative emissions’ can lead to self-deception about the nature and scale of the challenge today (Anderson & Peters (2016) PDF article17).
- The Paris-aligned decarbonisation scenarios of the IPCC, the International Energy Agency, the oil majors, etc., rely to a large extent on carbon capture and storage (CCS) to reduce greenhouse gas (GHG) emissions, and technologies such as bioenergy with carbon capture and storage (BECCS)16 to deliver ‘negative emissions’.
- BECCS is expected to be ecologically-destructive at scale (and it’s theoretically possible to decarbonise while avoiding BECCS18, though politically this is likely to be close to impossible).
- ‘Natural climate solutions’11 offer the hope of delivering climate change mitigation while preserving the ecosystems that we depend on for our security and wellbeing. While natural climate solutions would be valuable, they wouldn’t provide sufficient emissions mitigation by themselves to stay within global carbon budgets – we’d also need to rapidly reduce our GHG emissions to the atmosphere (and these are mainly due to our fossil-fuel use).
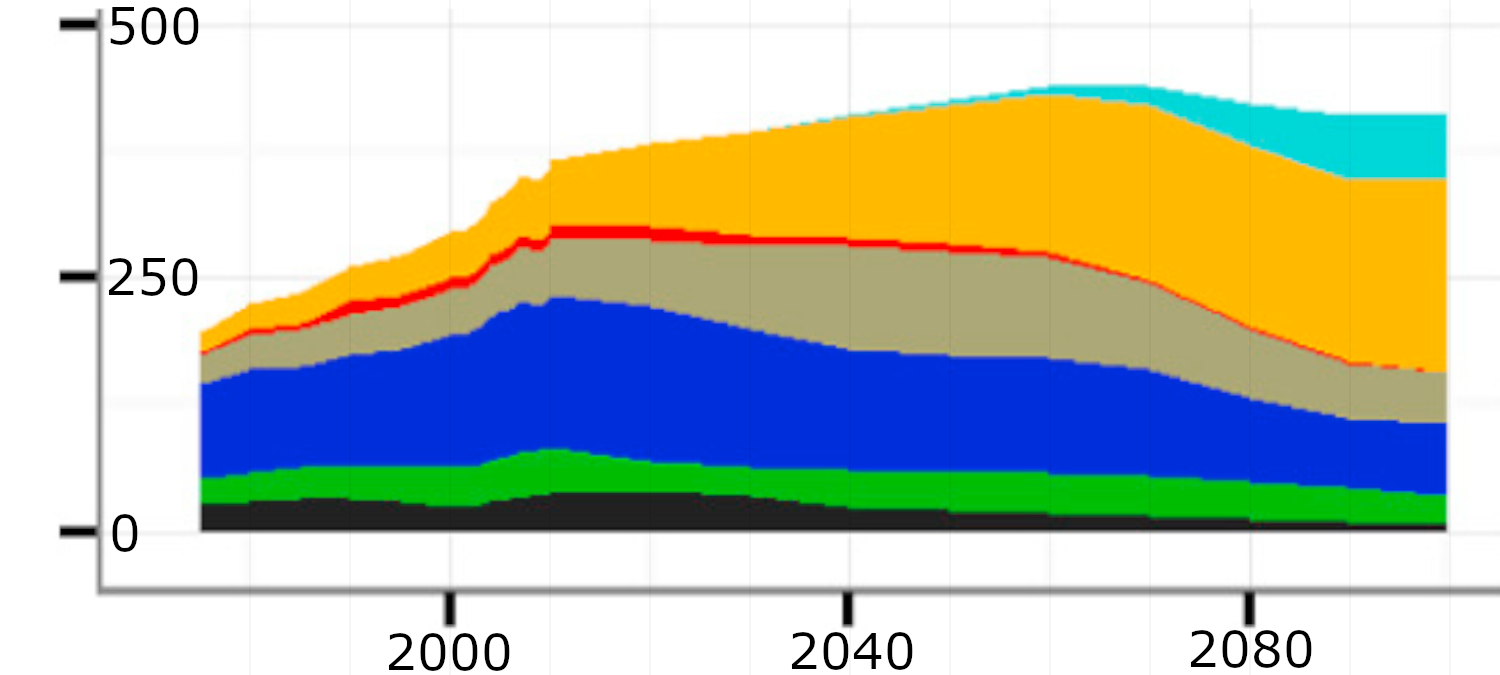
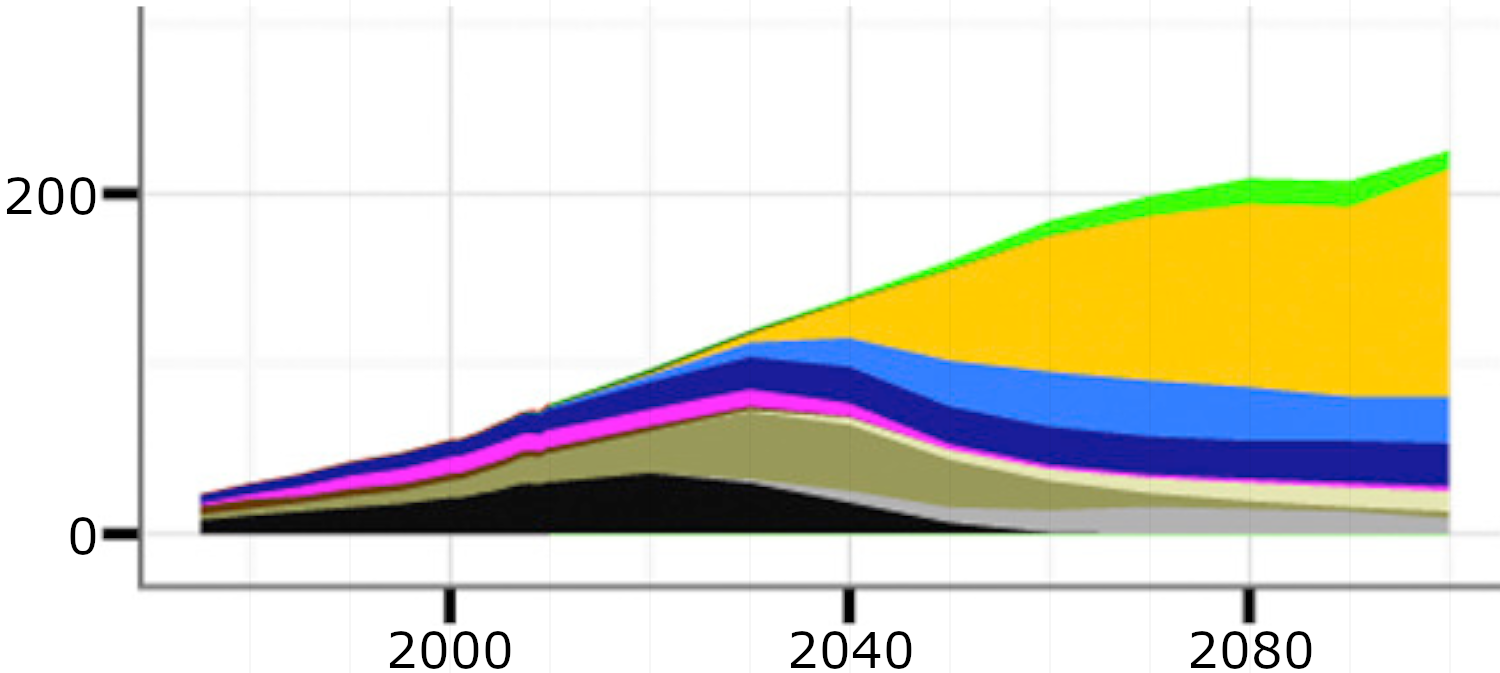
Two very different visions of decarbonisation:
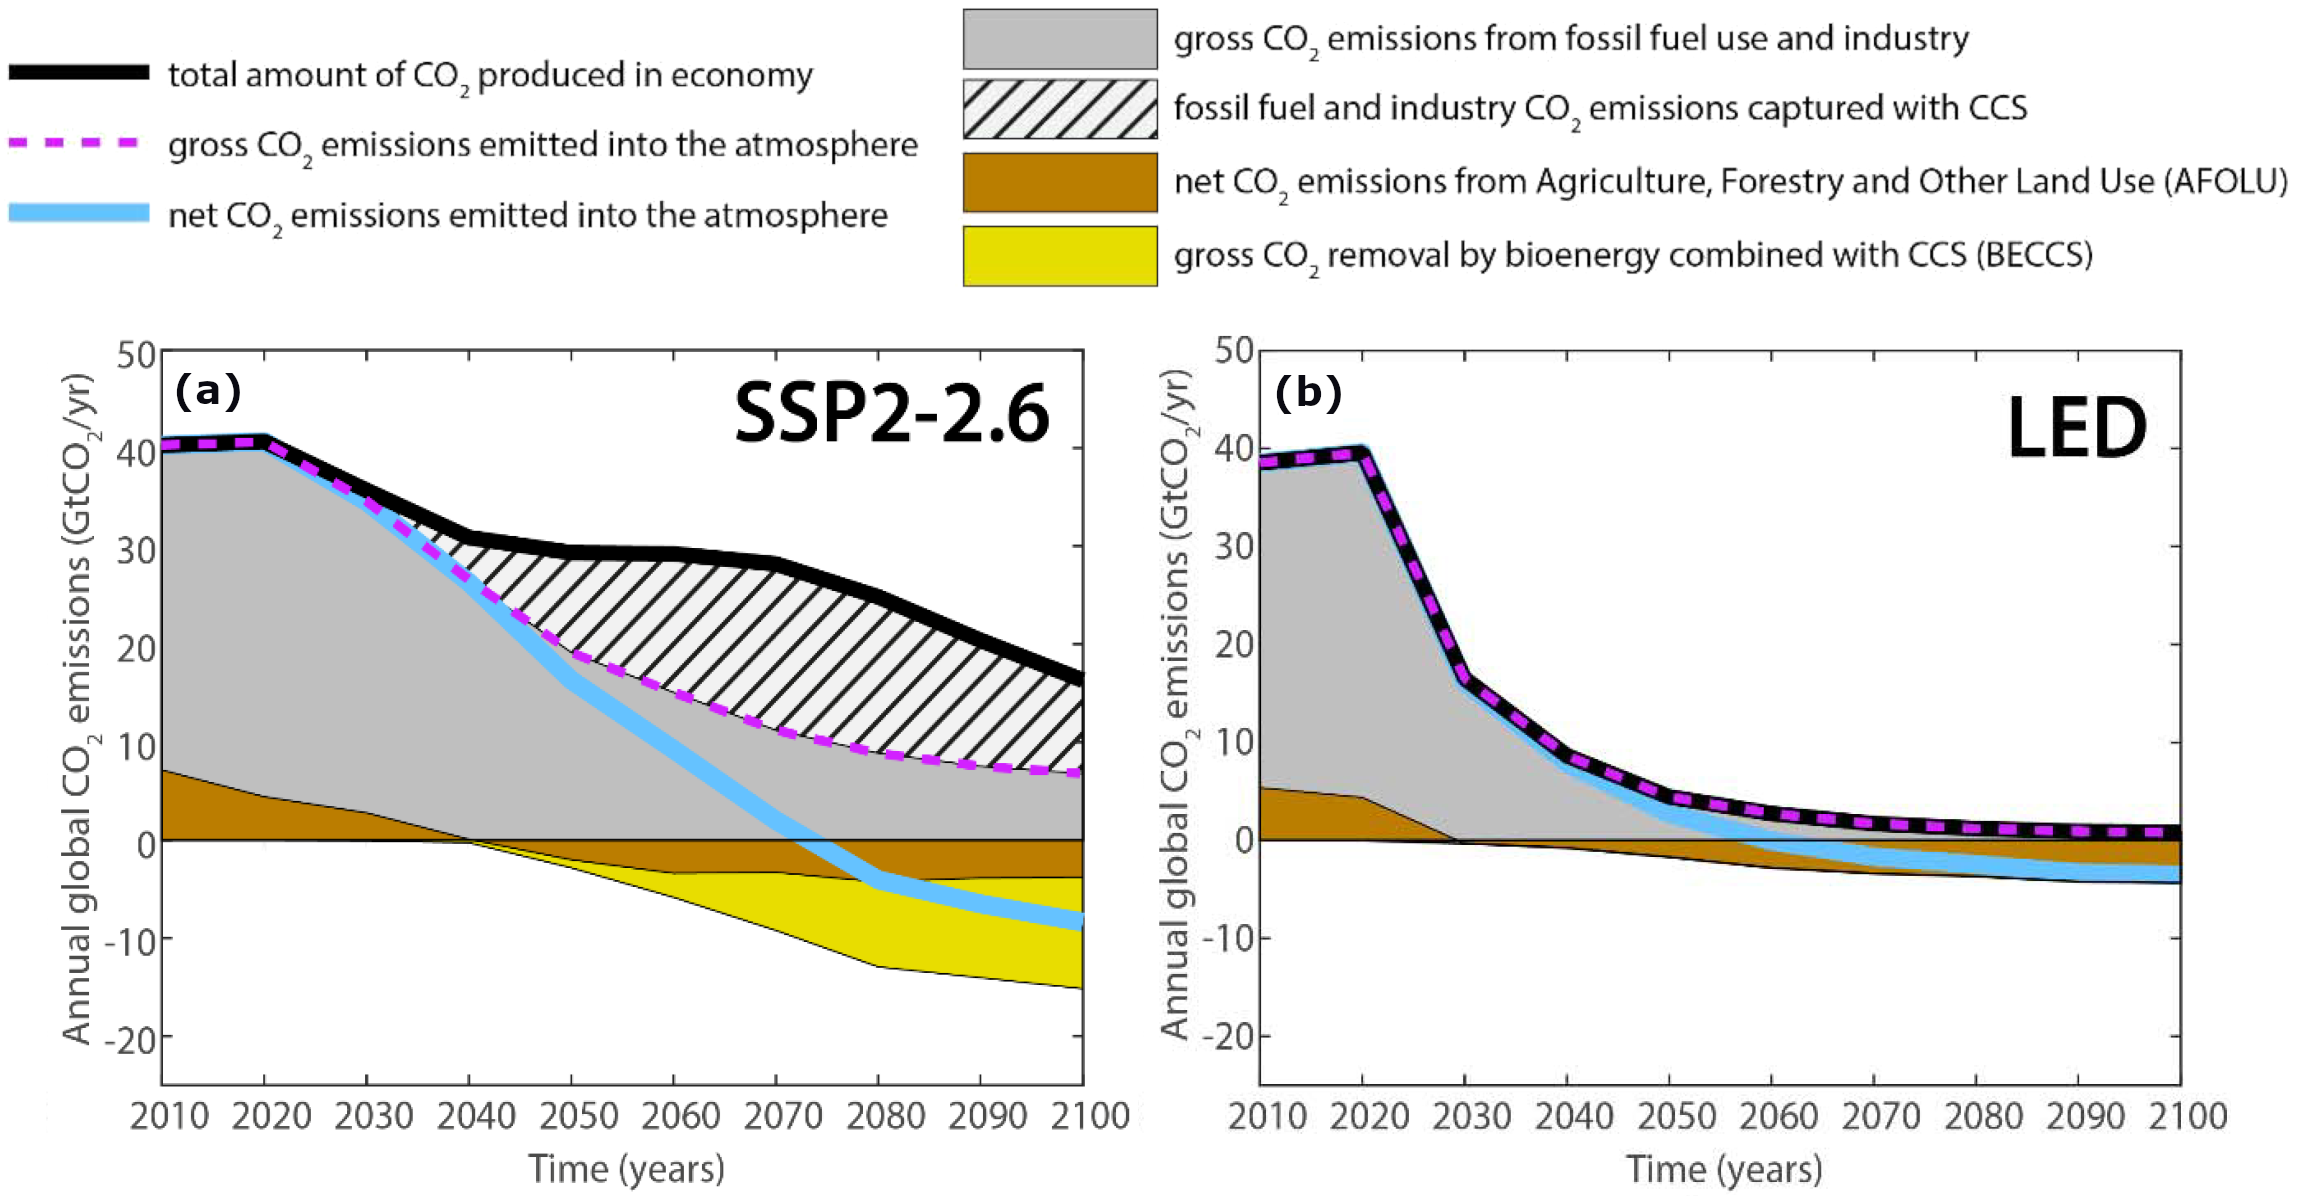
Source: Grubler – Presentation – A Low Energy Demand Scenario for Meeting the 1.5°C Target and Sustainable Development Goals without Negative Emissions24, Figure rearranged and relabelled.
(a) Fossil-fueled development, high energy demand, heavy reliance on CCS and BECCS. eg. Shell7 and other oil and gas companies.
- Increasing energy demand (or at least continuing high energy demand), similar to IPCC’s ‘SSP5’ scenario (and for 1.5°C scenarios, similar to ‘P4’ in IPCC’s 1.5°C special report3).
- Heavy fossil fuel use, which continues alongside increased electrification, and alongside increased use of hydrogen as an energy storage medium (and other ‘carbon-neutral fuels’).
- Heavy reliance on CCS (to reduce emissions), and technologies such as BECCS (to achieve negative emissions).
(b) Leave fossil-fuels in the ground, low energy demand, no CCS or BECCS. eg. Greenpeace and One Earth Climate Model funded by the Leonardo DiCaprio Foundation (discussed here23 by David Hone from Shell).
- Low energy demand20,21, similar to IPCC’s Low energy demand ‘LED’ scenario and ‘P1’ in IPCC’s 1.5°C special report.
- Rapid reduction in fossil fuel use in the near future.
- No CCS or BECCS.
‘(a)’ and ‘(b)’ are two very different approaches to decarbonisation, and in a sense they’re at opposite extremes. Mainstream scenarios are, of course, closer to ‘a’ than ‘b’; ‘b’ is considered radical. Mainstream ‘clean energy’ scenarios are also likely to be closer to ‘a’, when they project increasing energy consumption, ongoing fossil fuel consumption, and reliance on CCS. eg. DNV-GL’s Energy Transition Outlook 2018.
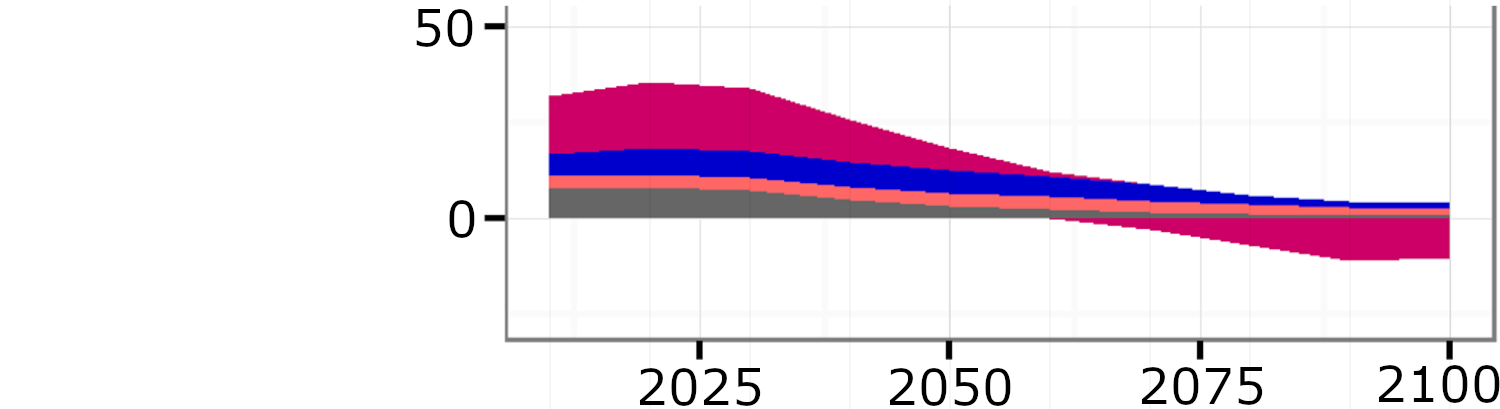
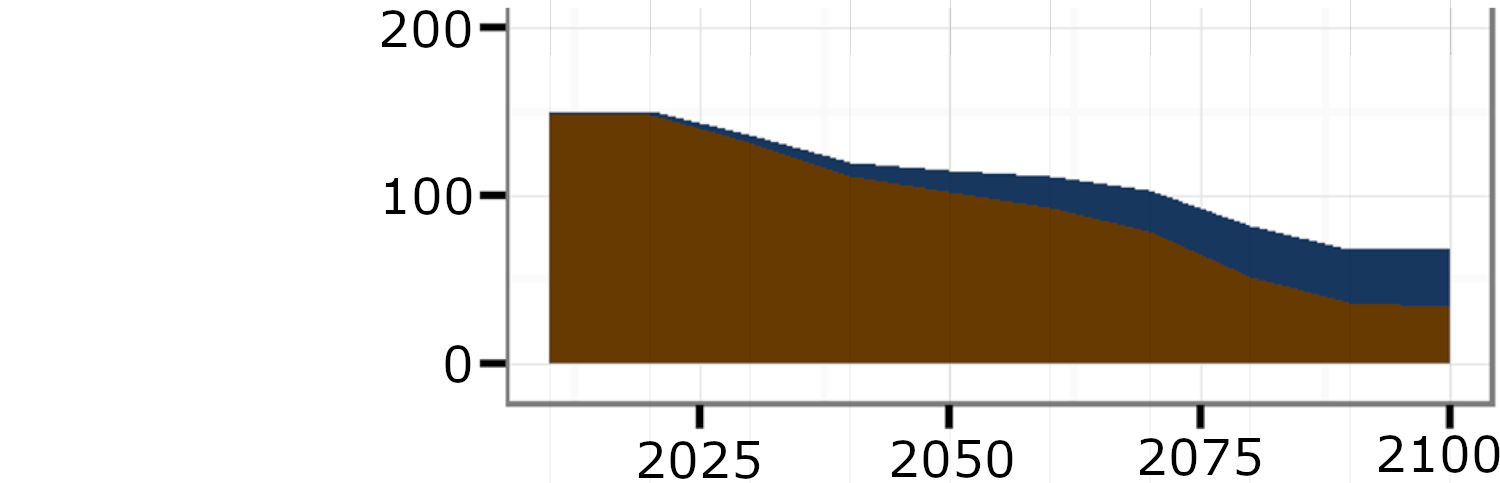
Global CO2 emissions in the LED and SSP2 scenarios
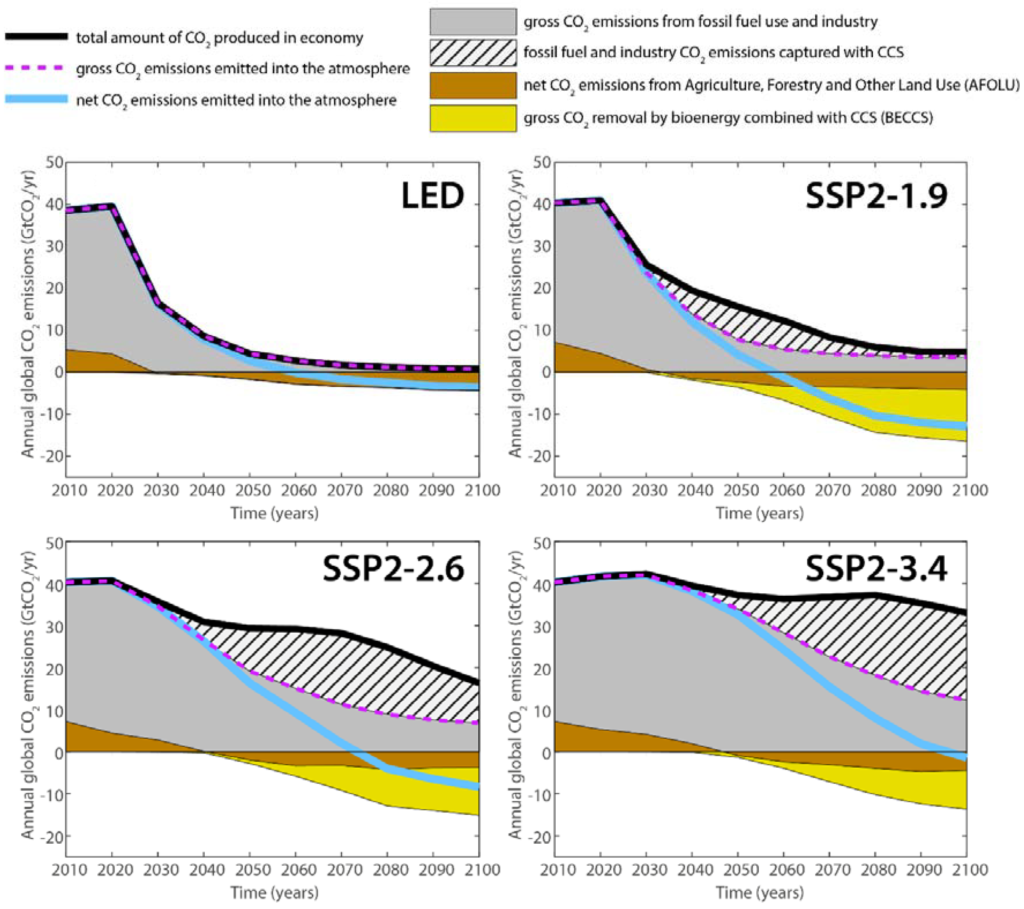
Source: Grubler et al (2018)22, Supplementary Fig. 17
“We have constructed what we in DNV GL see as ’a most likely future’ for energy through to 2050. This contrasts with scenario-based approaches, where possible contrasting futures, including wishful scenarios are set up against each other”
https://eto.dnvgl.com/2018/main-report
As with many mainstream scenarios, DNV-GL’s Energy Transition Outlook 2018 overshoots the carbon budgets that would be required to meet the goals of the Paris Agreement.
“the future we forecast is not the future humankind desires. Even with a peaking of energy demand, and fast uptake of renewables and electric vehicles, the energy transition trajectory is not fast enough for the world to meet the ambitions of the Paris Agreement. Indeed, even if all electricity was generated using renewable sources from this day forward, we would still exceed the 2°C carbon budget.”
https://eto.dnvgl.com/2018/foreword
We’re living in interesting times. Some of the leaders in the global energy transition aren’t expecting the nations of the world to meet the Paris Agreement climate goals. We should try to understand why they expect us to fail to meet these targets, and we should also consider a range of other perspectives on this challenge.
Some broader questions when comparing projections for future global decarbonisation (along with short-term economic and security concerns)
- Do they meet the Paris Agreement goals (to address anthropogenic climate change)?
- Do they rely heavily on fossil-fuel use?
- How much electrification is projected?
- Do they anticipate the widespread use of hydrogen as a fuel in the future, and of other ‘carbon-neutral fuels’?
- How do they anticipate suppling the most difficult-to-decarbonise energy services14?
- Would they resort to forms of geoengineering to try to stabilise the climate system?
- Do they envisage decoupling GDP from energy-related GHG emissions? Decoupling GDP from damage to the biosphere? Decoupling GDP from energy consumption? Decoupling GDP from population? Alternatives to GDP (and to growth) are, of course, out of the picture?
- Projected increases in energy demand? Any chance of a reduction in energy demand?
- Are they ecologically-sound (ie. do they protect the biosphere and Earth’s natural cycles)?
- Do they make use of ‘natural climate solutions’11?
- Do they rely heavily on bioenergy with carbon capture and storage (BECCS) to achieve ‘negative emissions’? The proposed future technology ‘BECCS’ is expected to be ecologically-destructive (when scaled up), and to compete with food production.
- Would their proposals for decarbonising each sector of the economy promote humane societies, healthy democracies, women’s empowerment, civil society, the rights of minorities, freedom of expression, etc.?
Greenhouse gas emissions
Global emissions projections to 2100 and Paris 2015 target
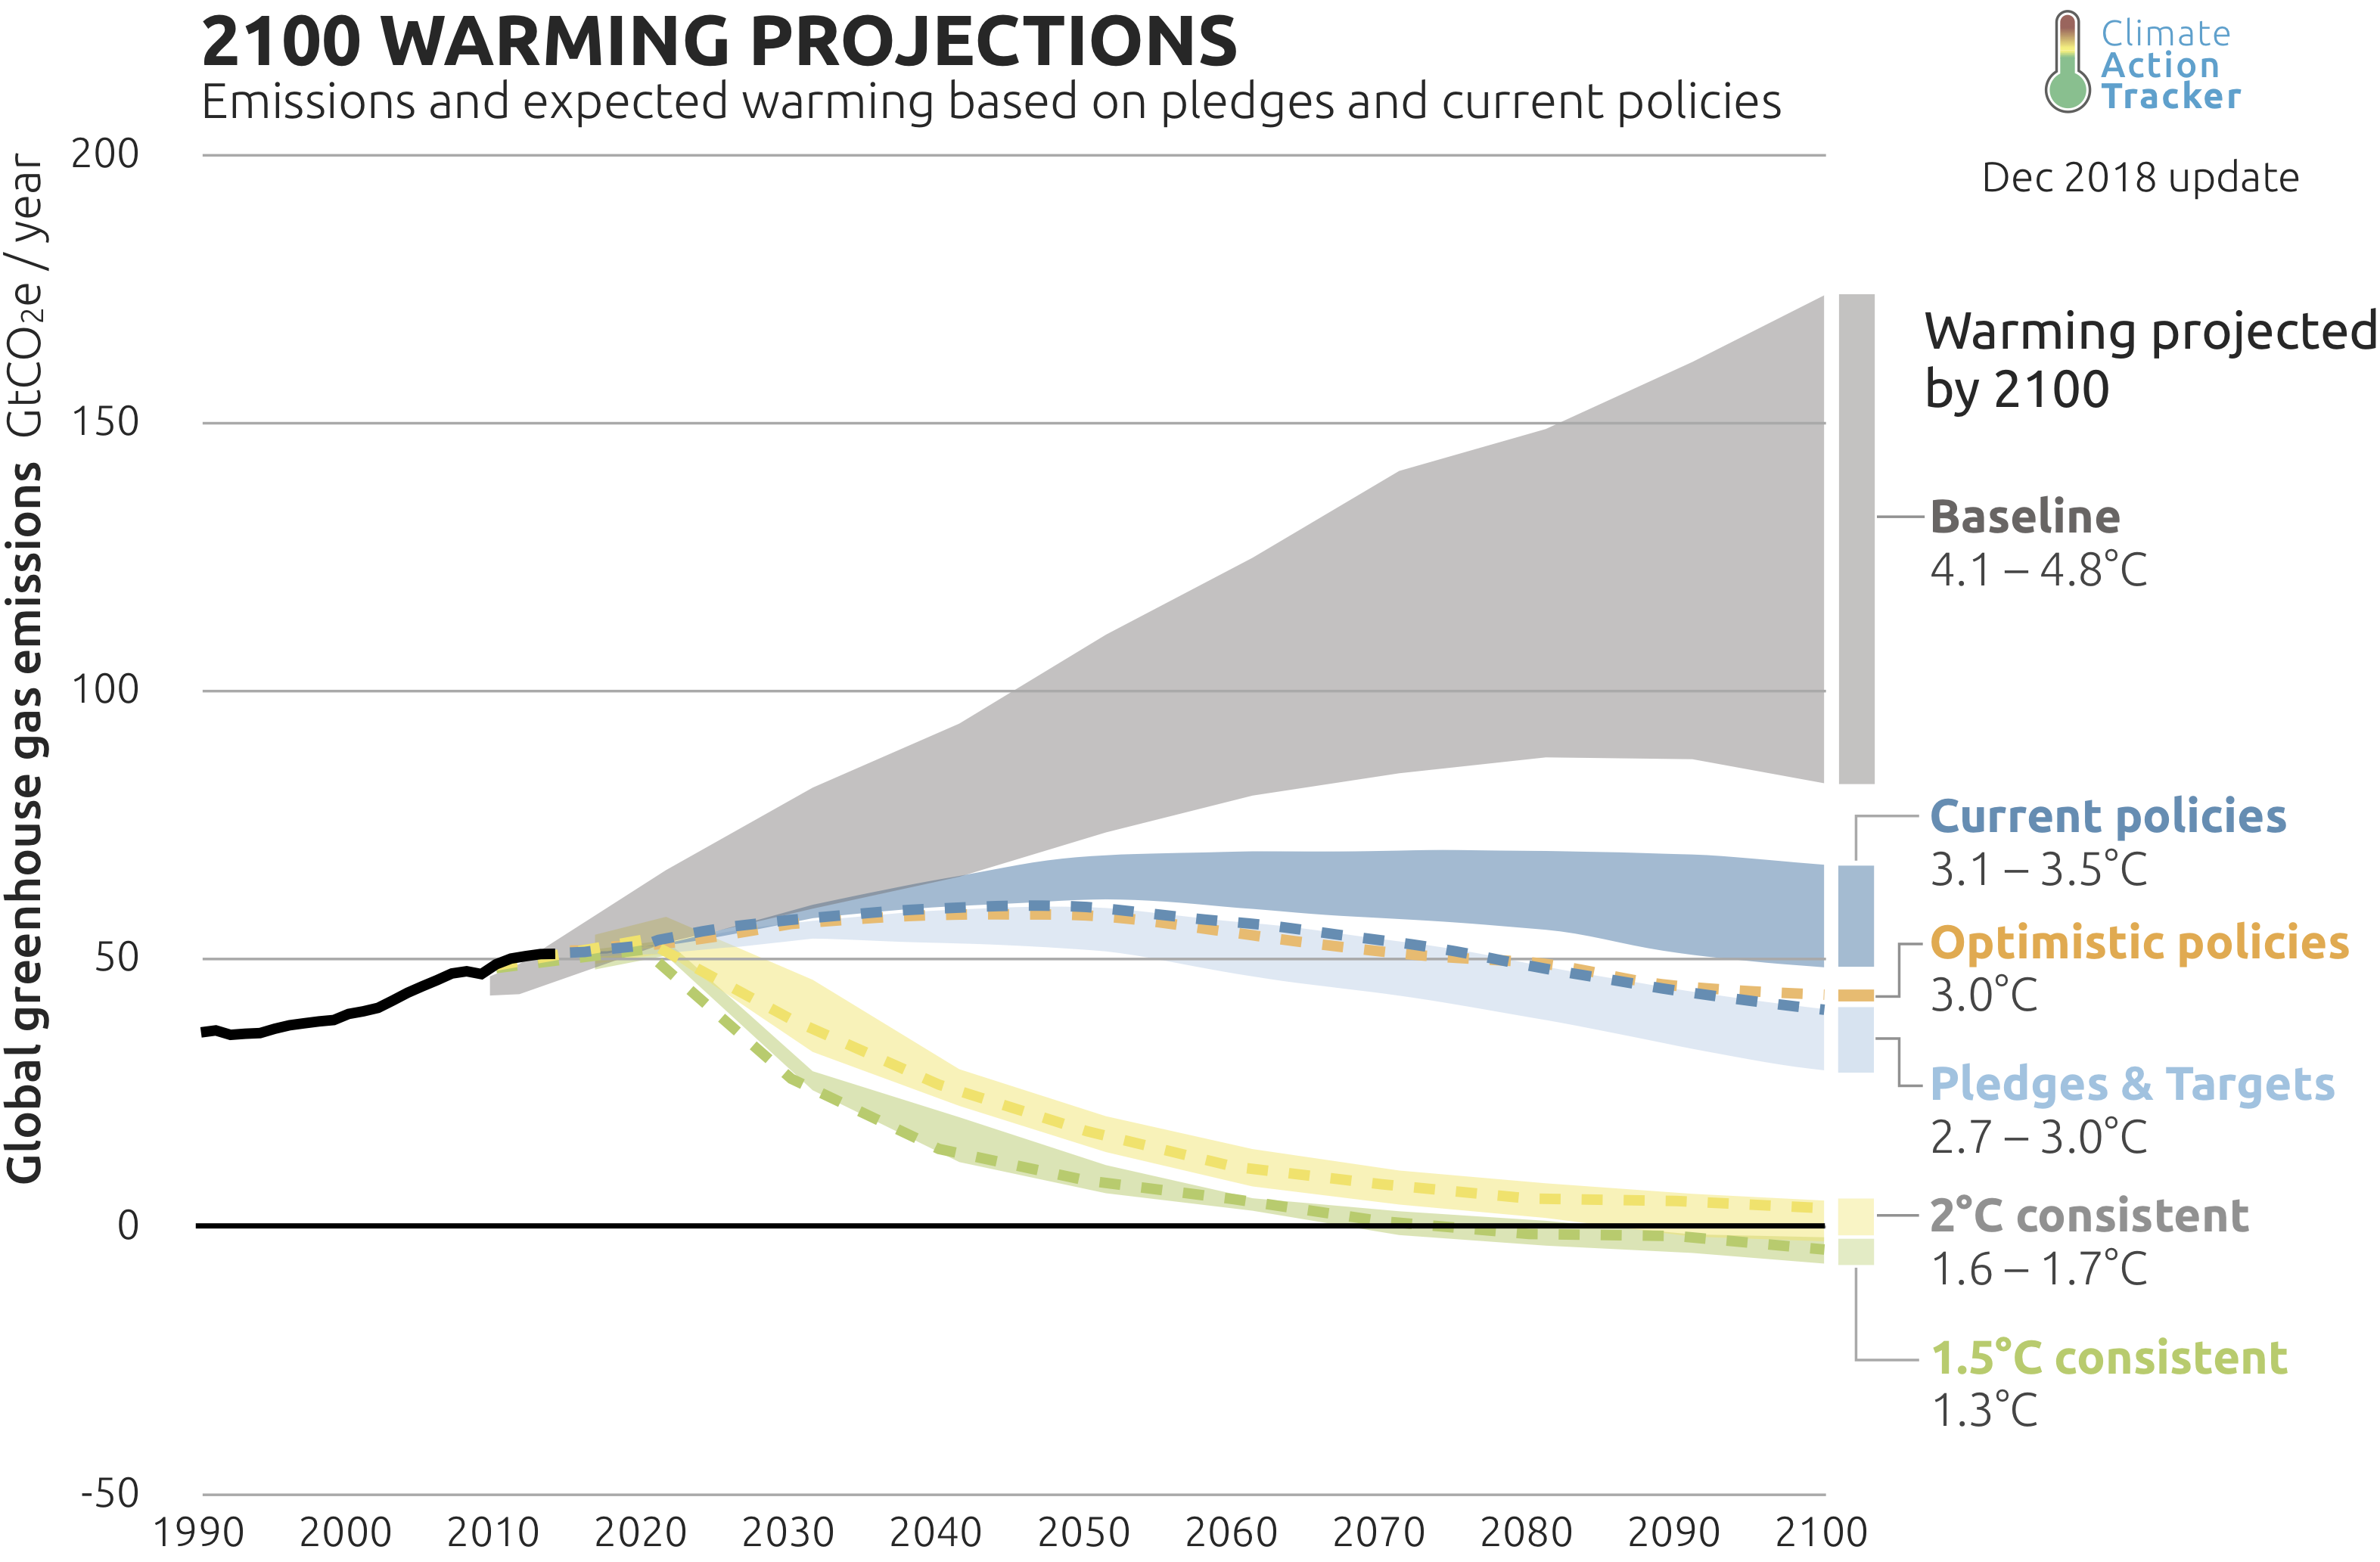
Source: https://climateactiontracker.org/global/temperatures/5
Global emissions projections to 2030 and emissions gaps to Paris target
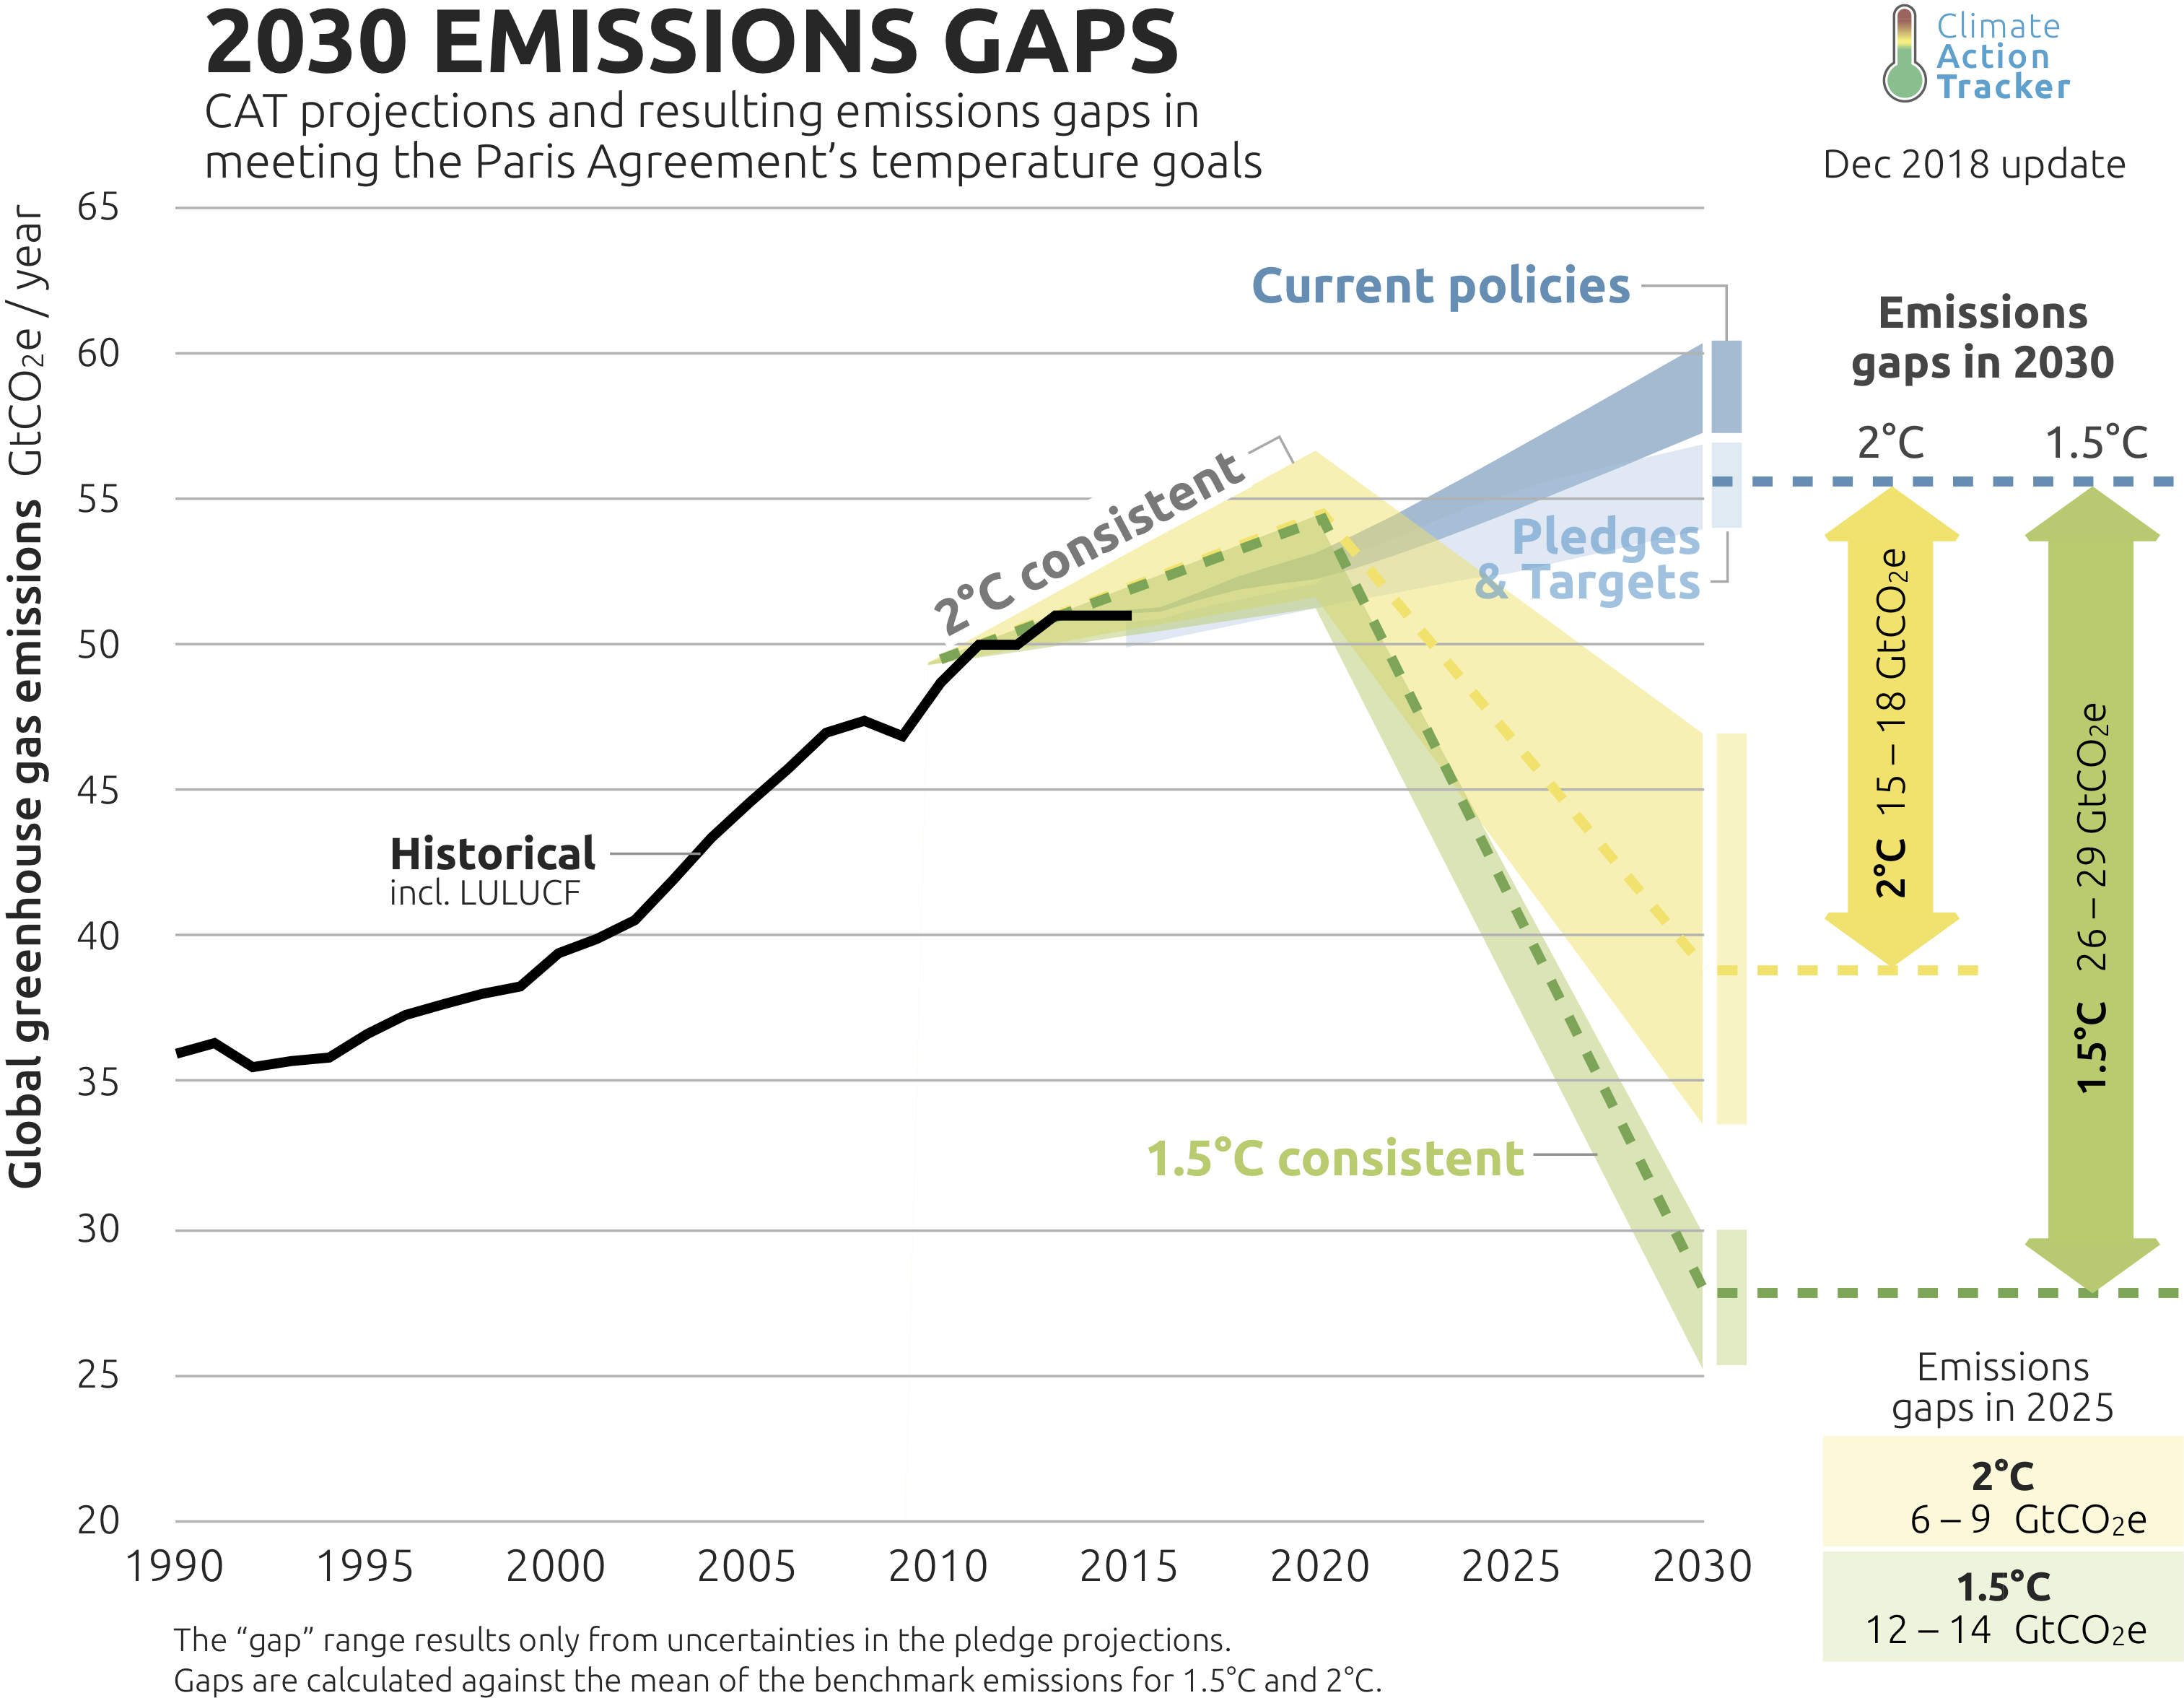
Source: https://climateactiontracker.org/global/cat-emissions-gaps/6
Shared Socio-Economic Pathways (SSPs)
Overview of basic Shared Socio-Economic Pathways (SSPs) and the energy sector elements of the narratives
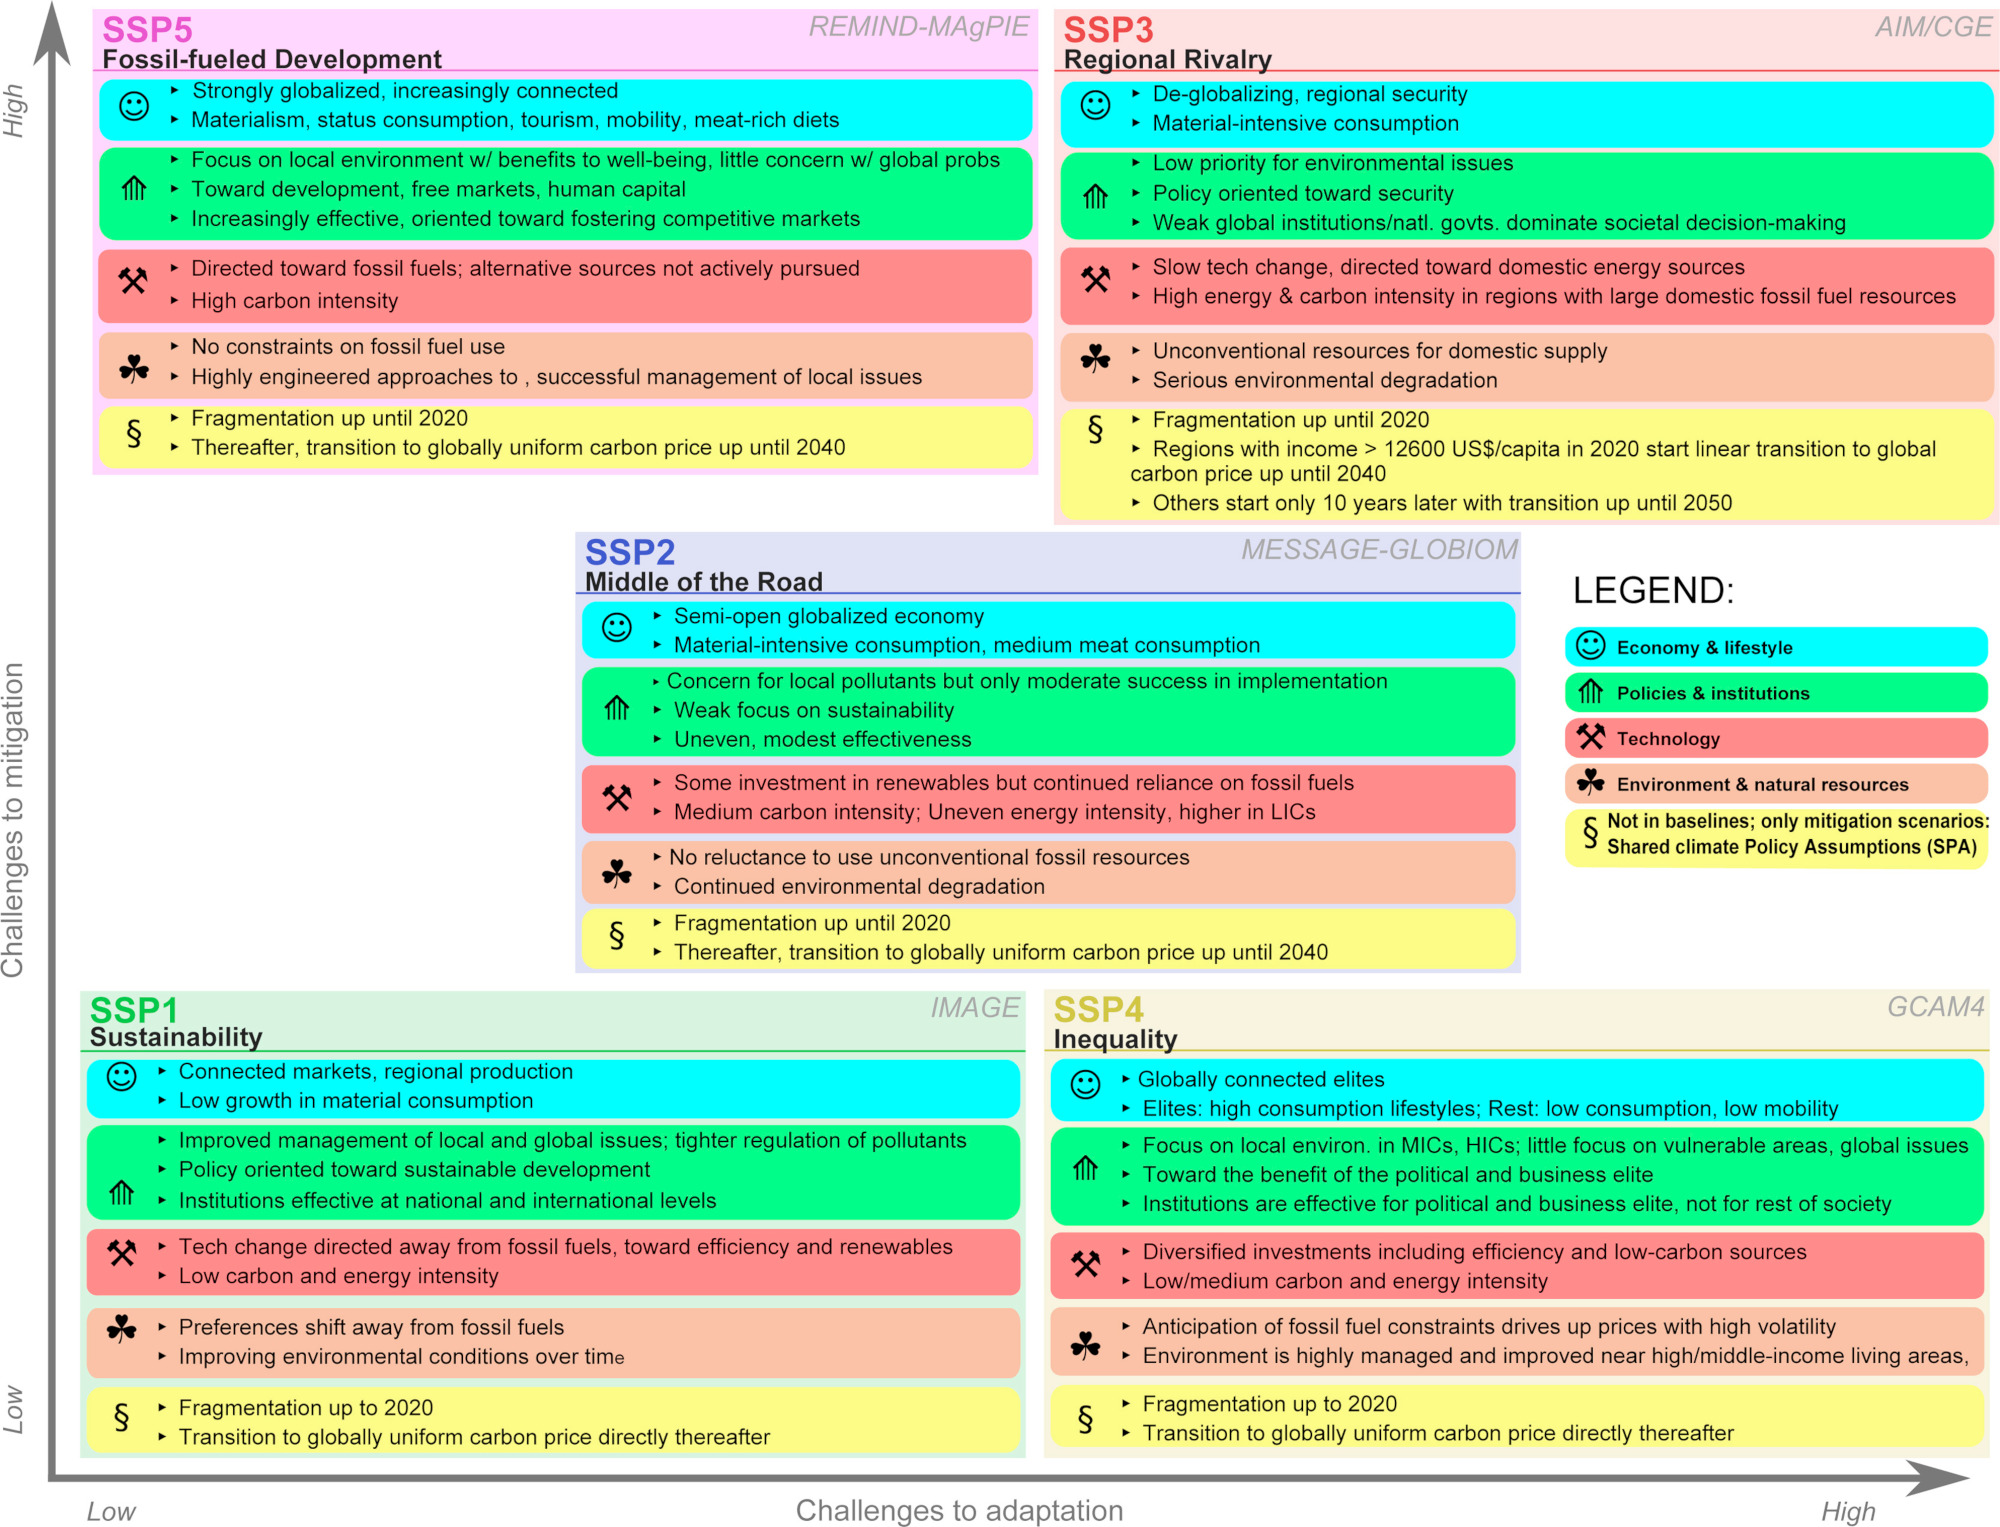
Source: Bauer et al (2017)1, Fig. 1
Global CO2 emissions from fossil fuels and industry
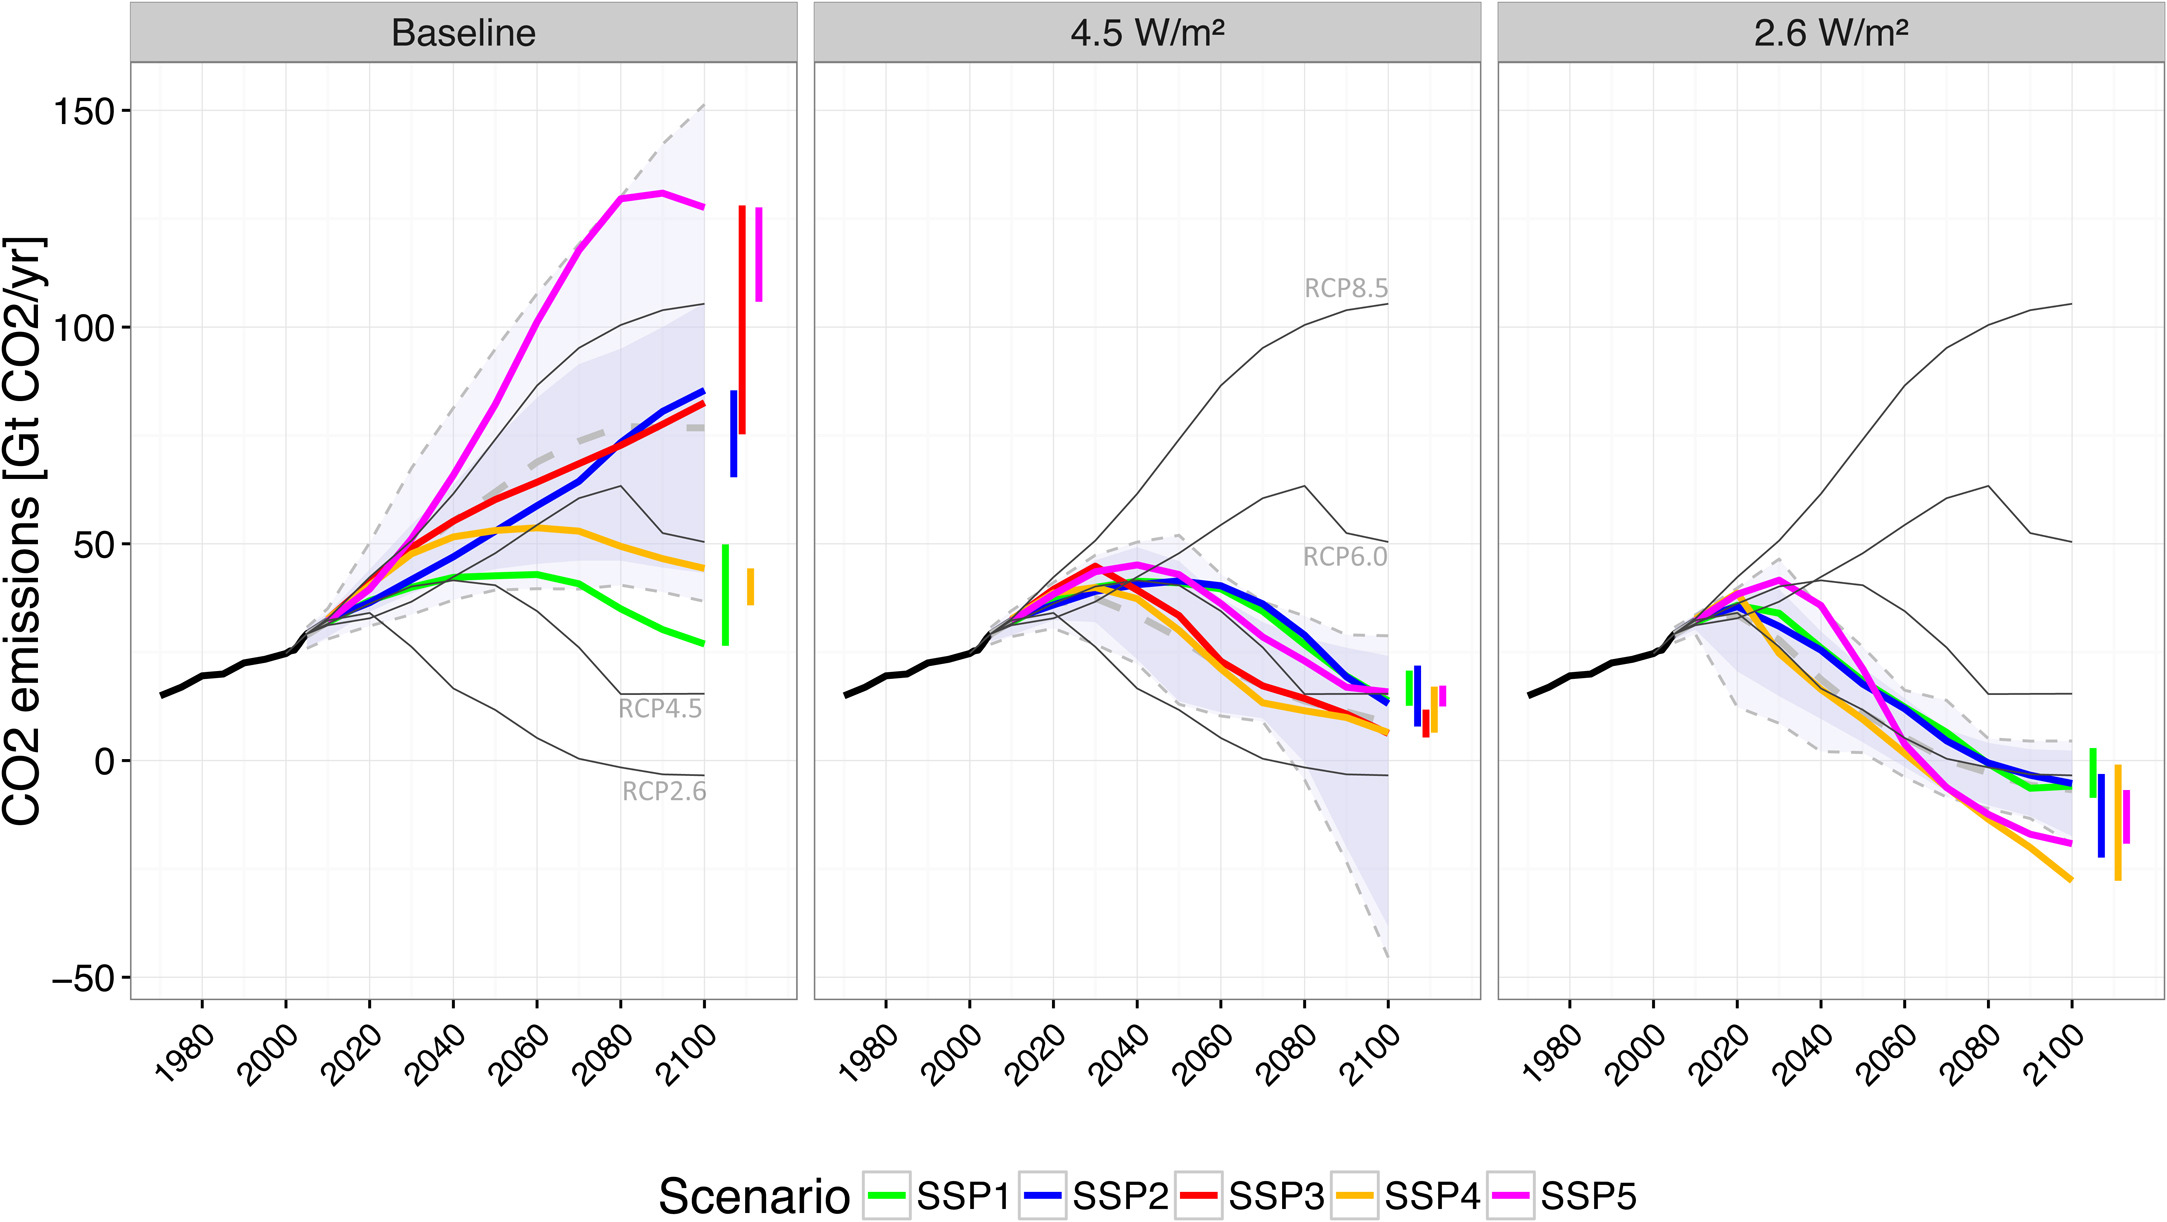
Source: Bauer et al (2017)1, Fig. 8
CO2 emissions for energy by sector
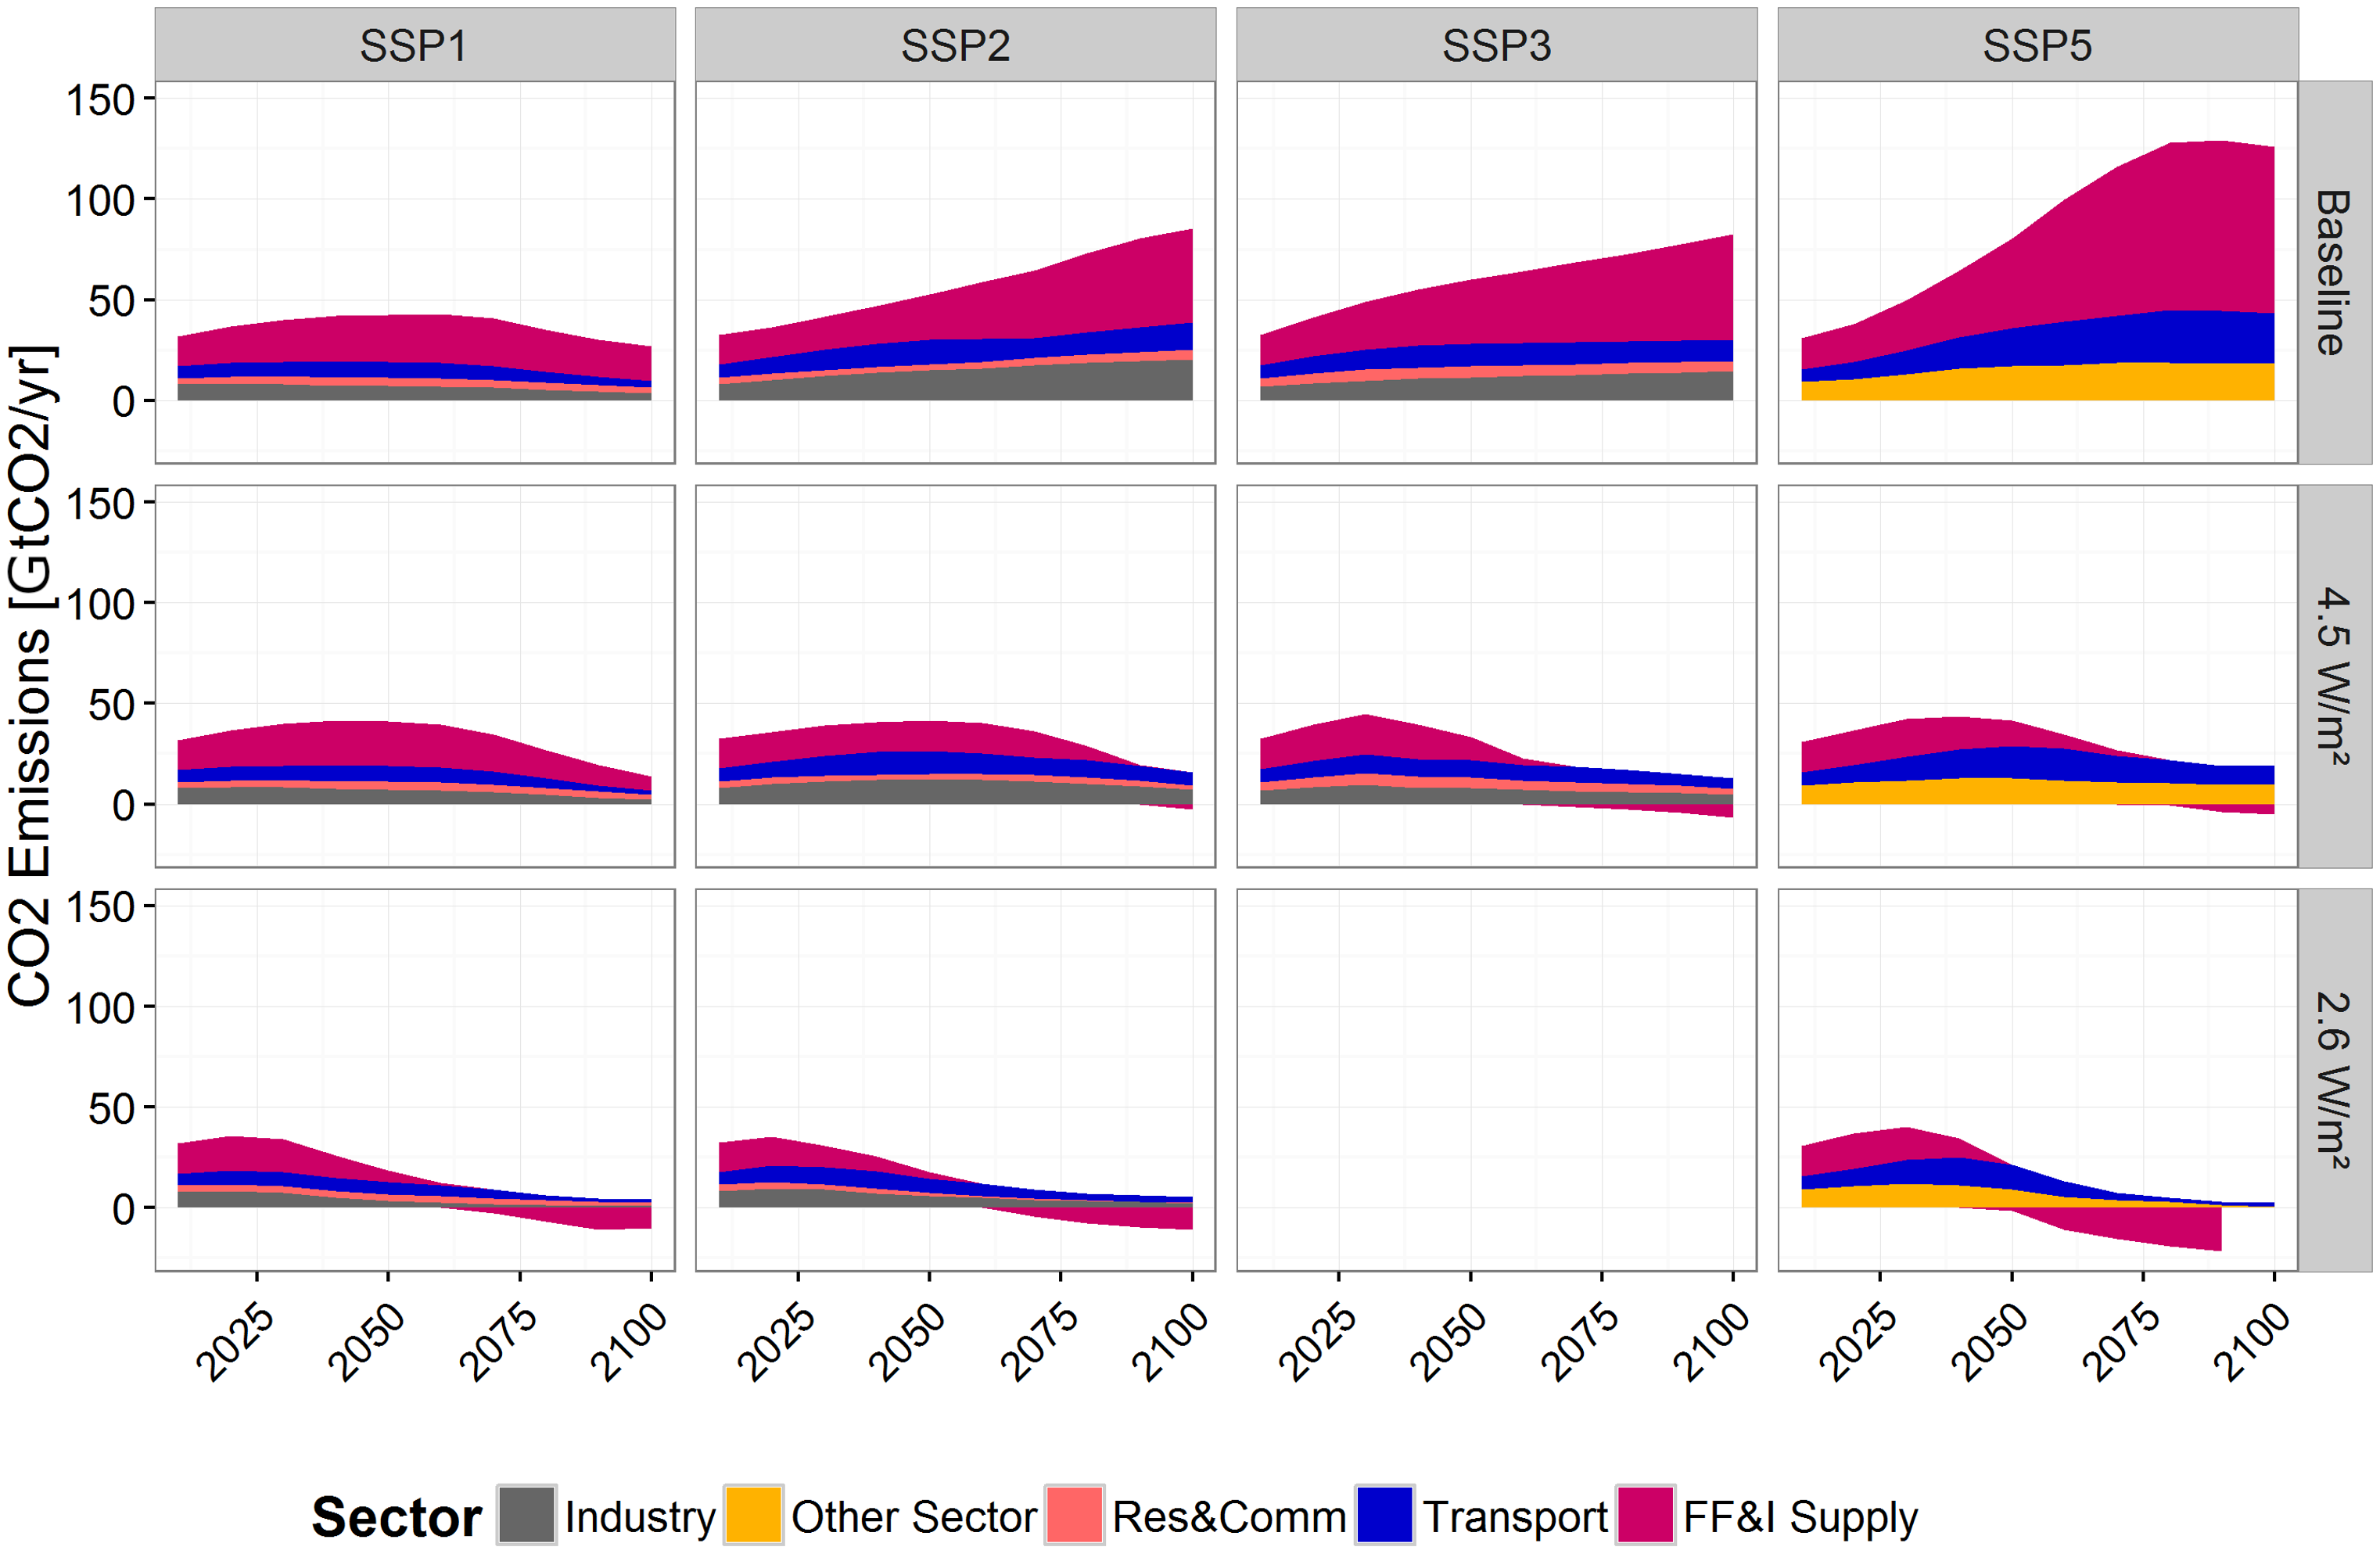
Source: Bauer et al (2017)2, Fig. S9
Global primary energy mix across SSPs and climate policy cases
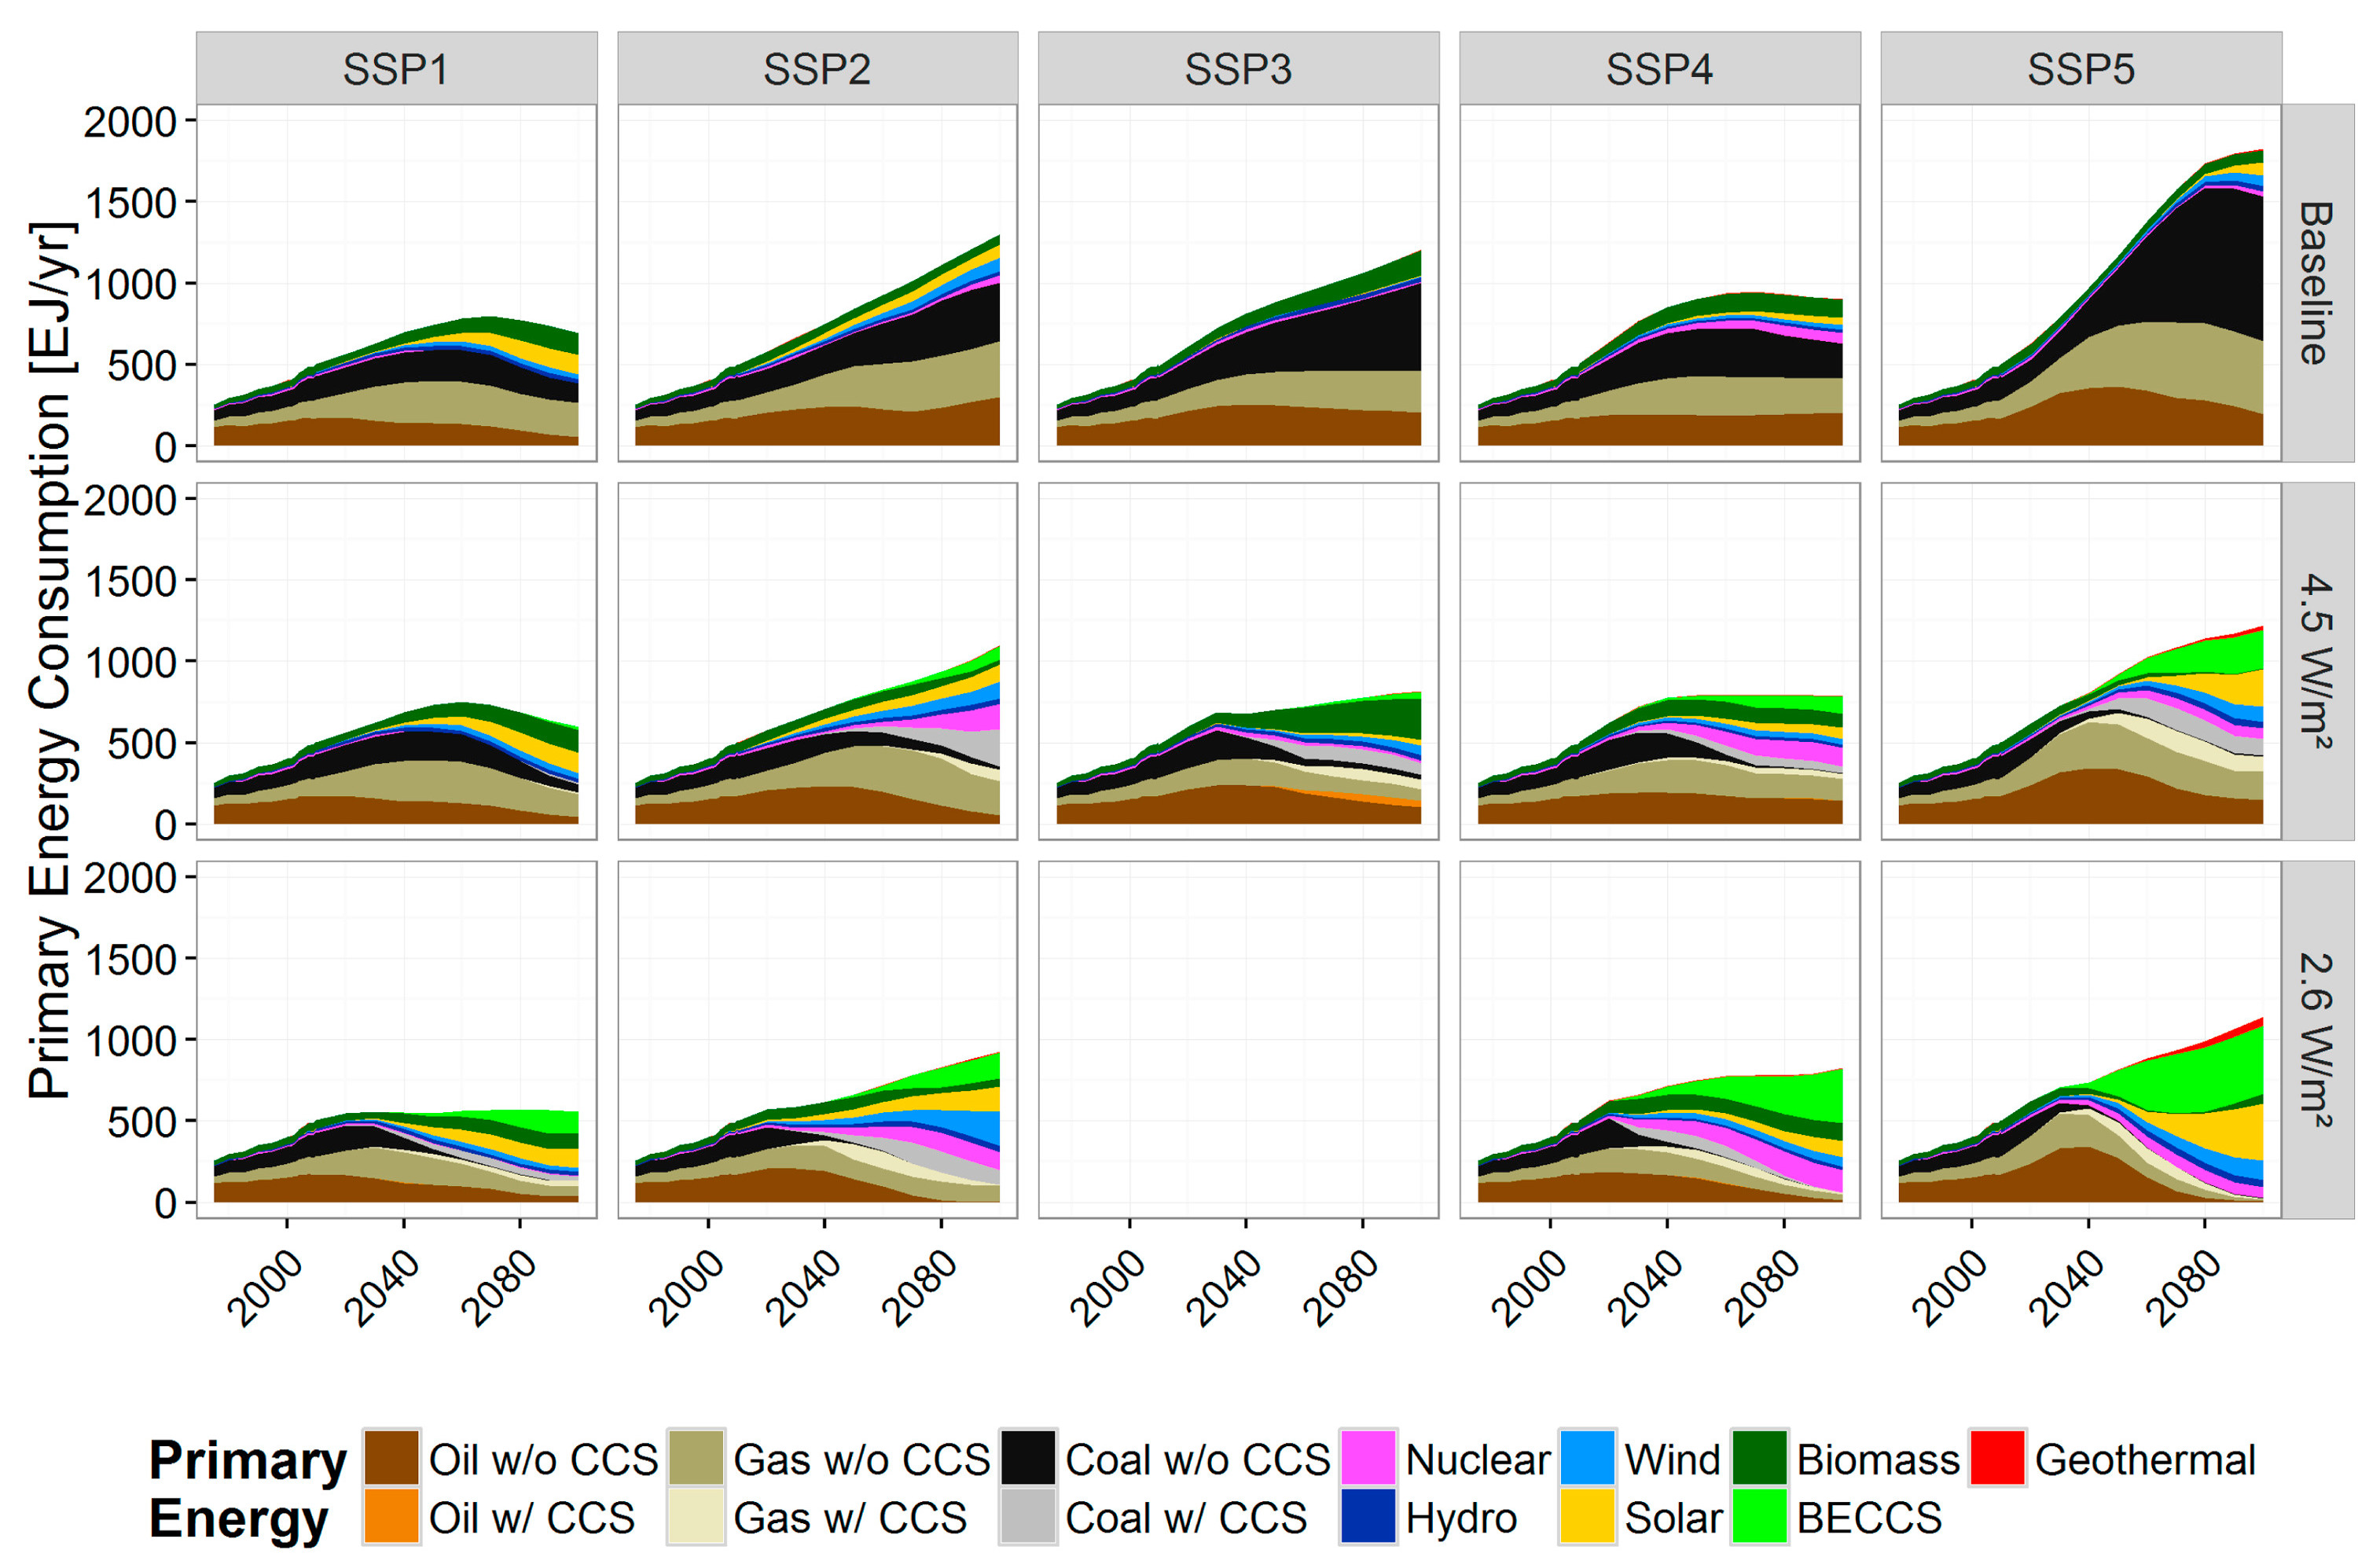
Source: Bauer et al (2017)1, Fig. 5a
Global final energy mix across SSPs and climate stabilisation cases
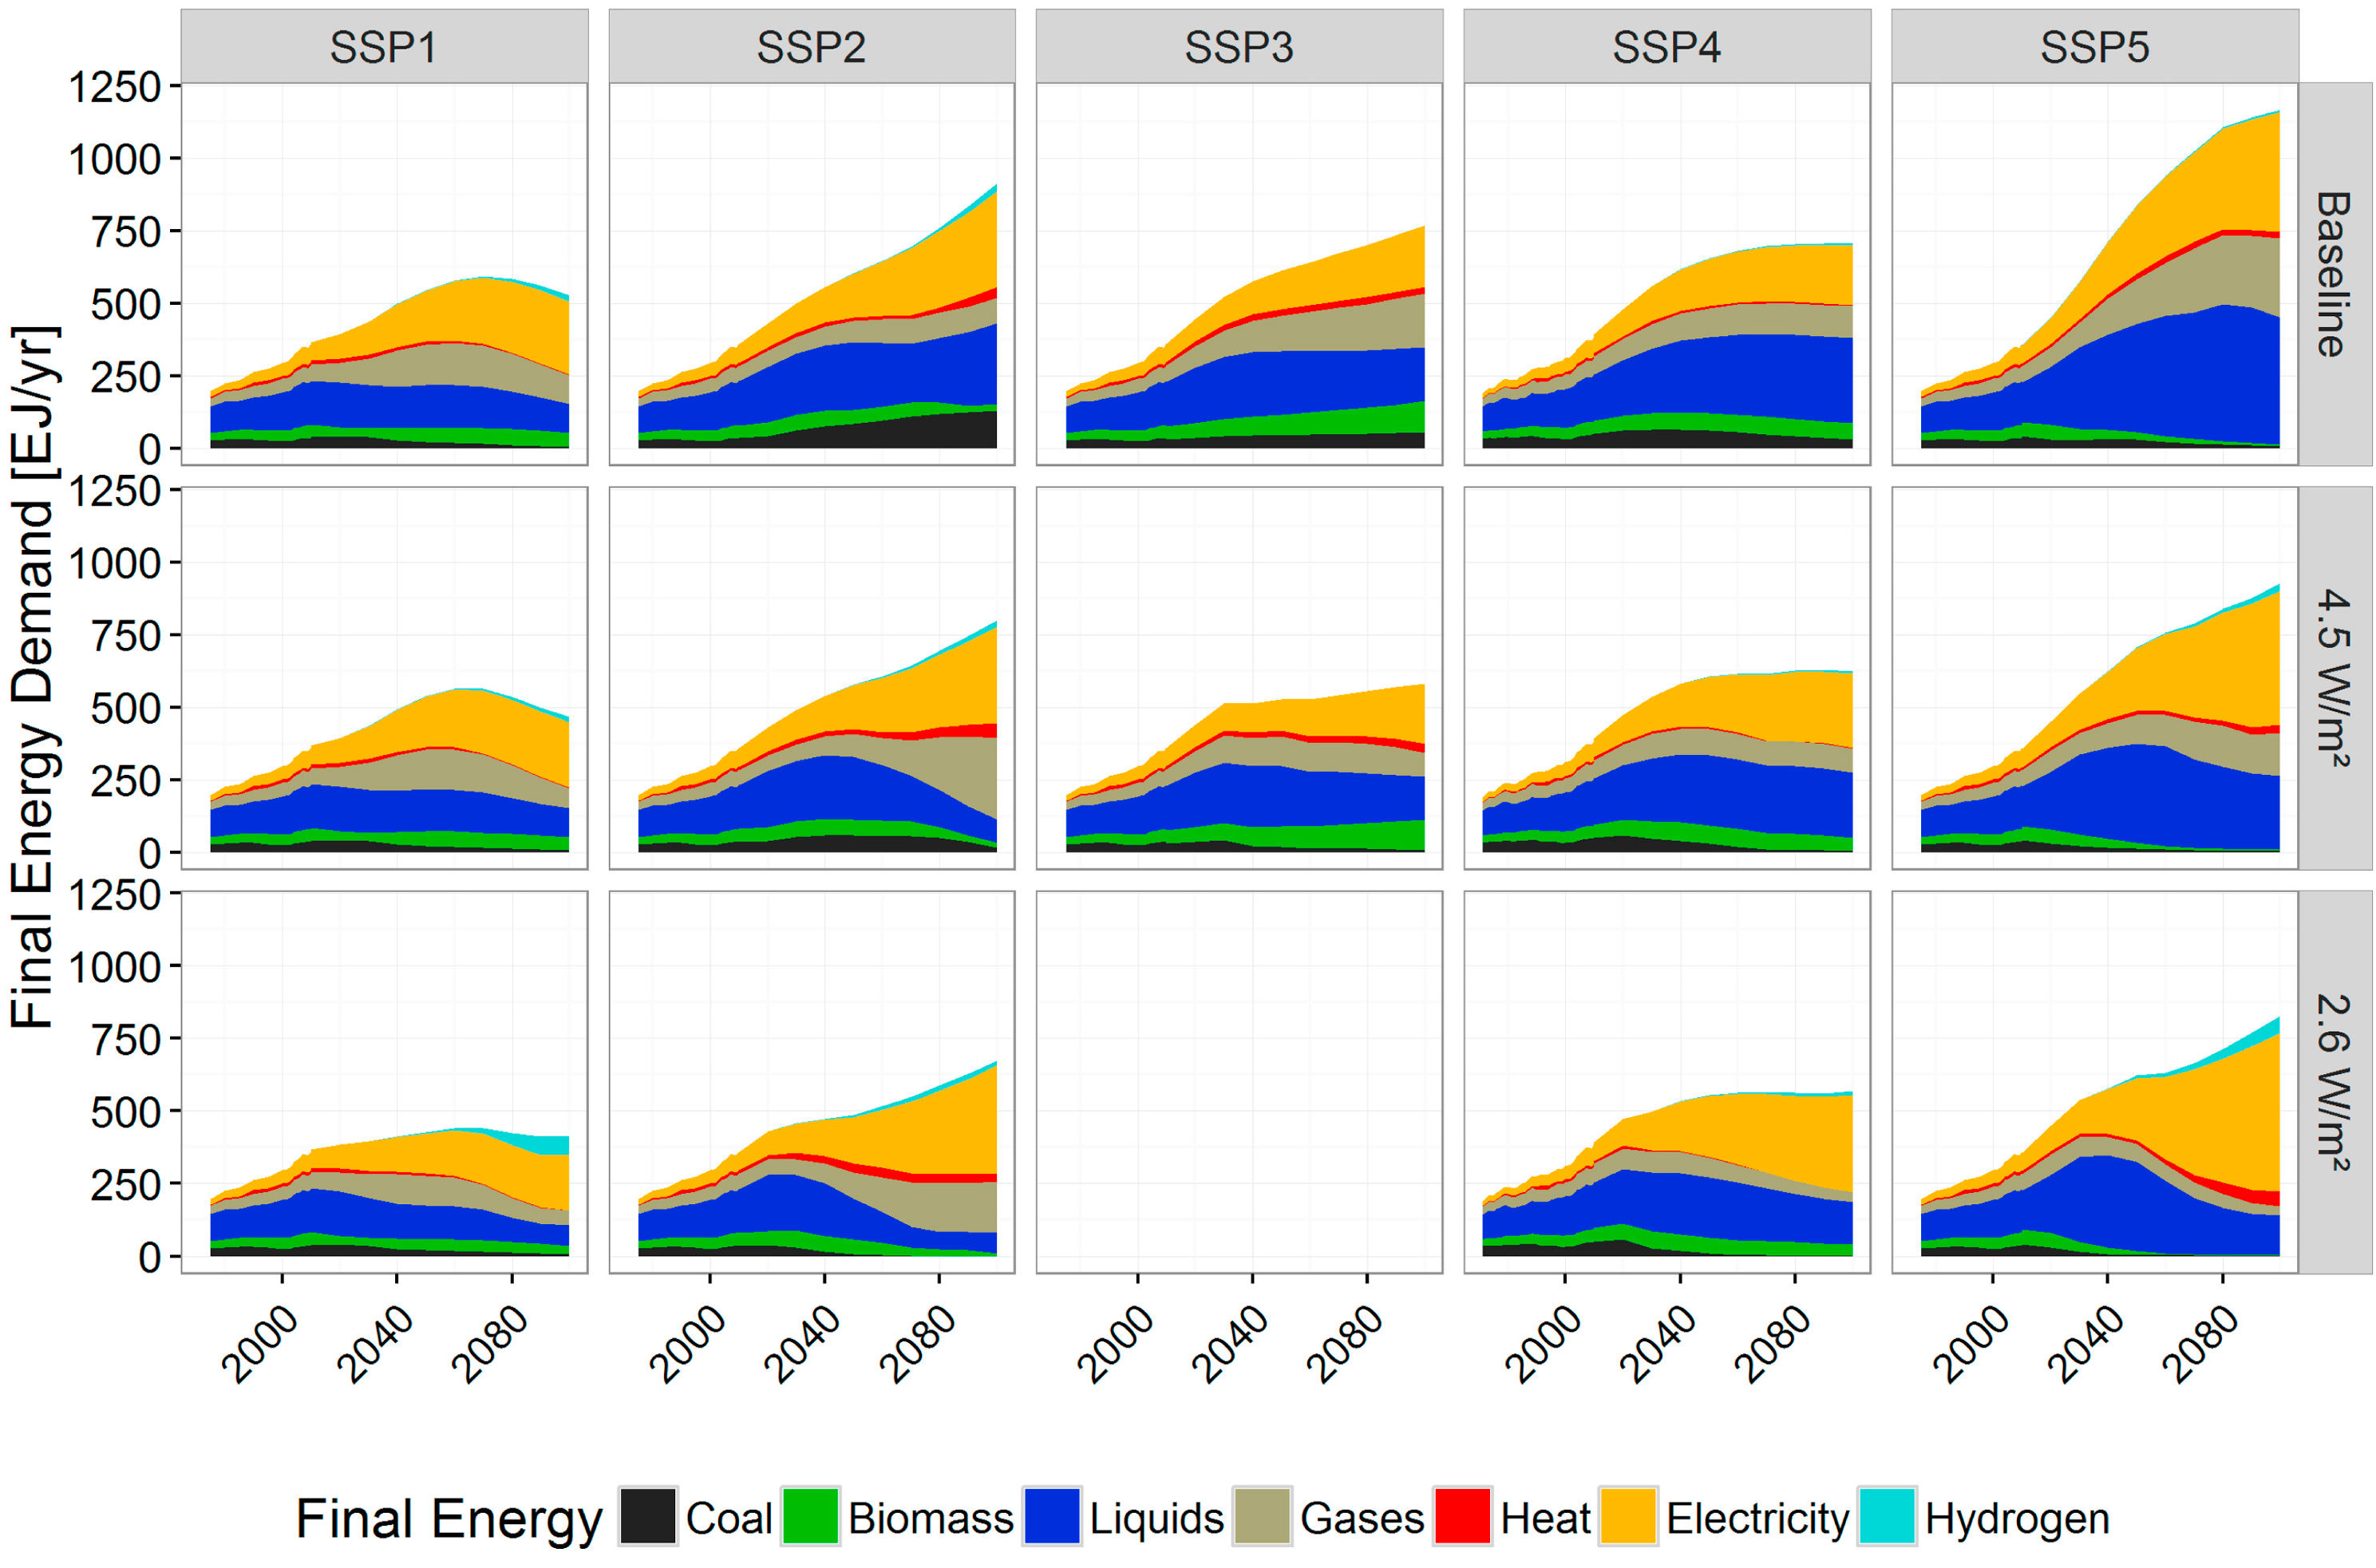
Source: Bauer et al (2017)1, Fig. 4a
Global power generation by technology differentiated by SSPs and policy scenario
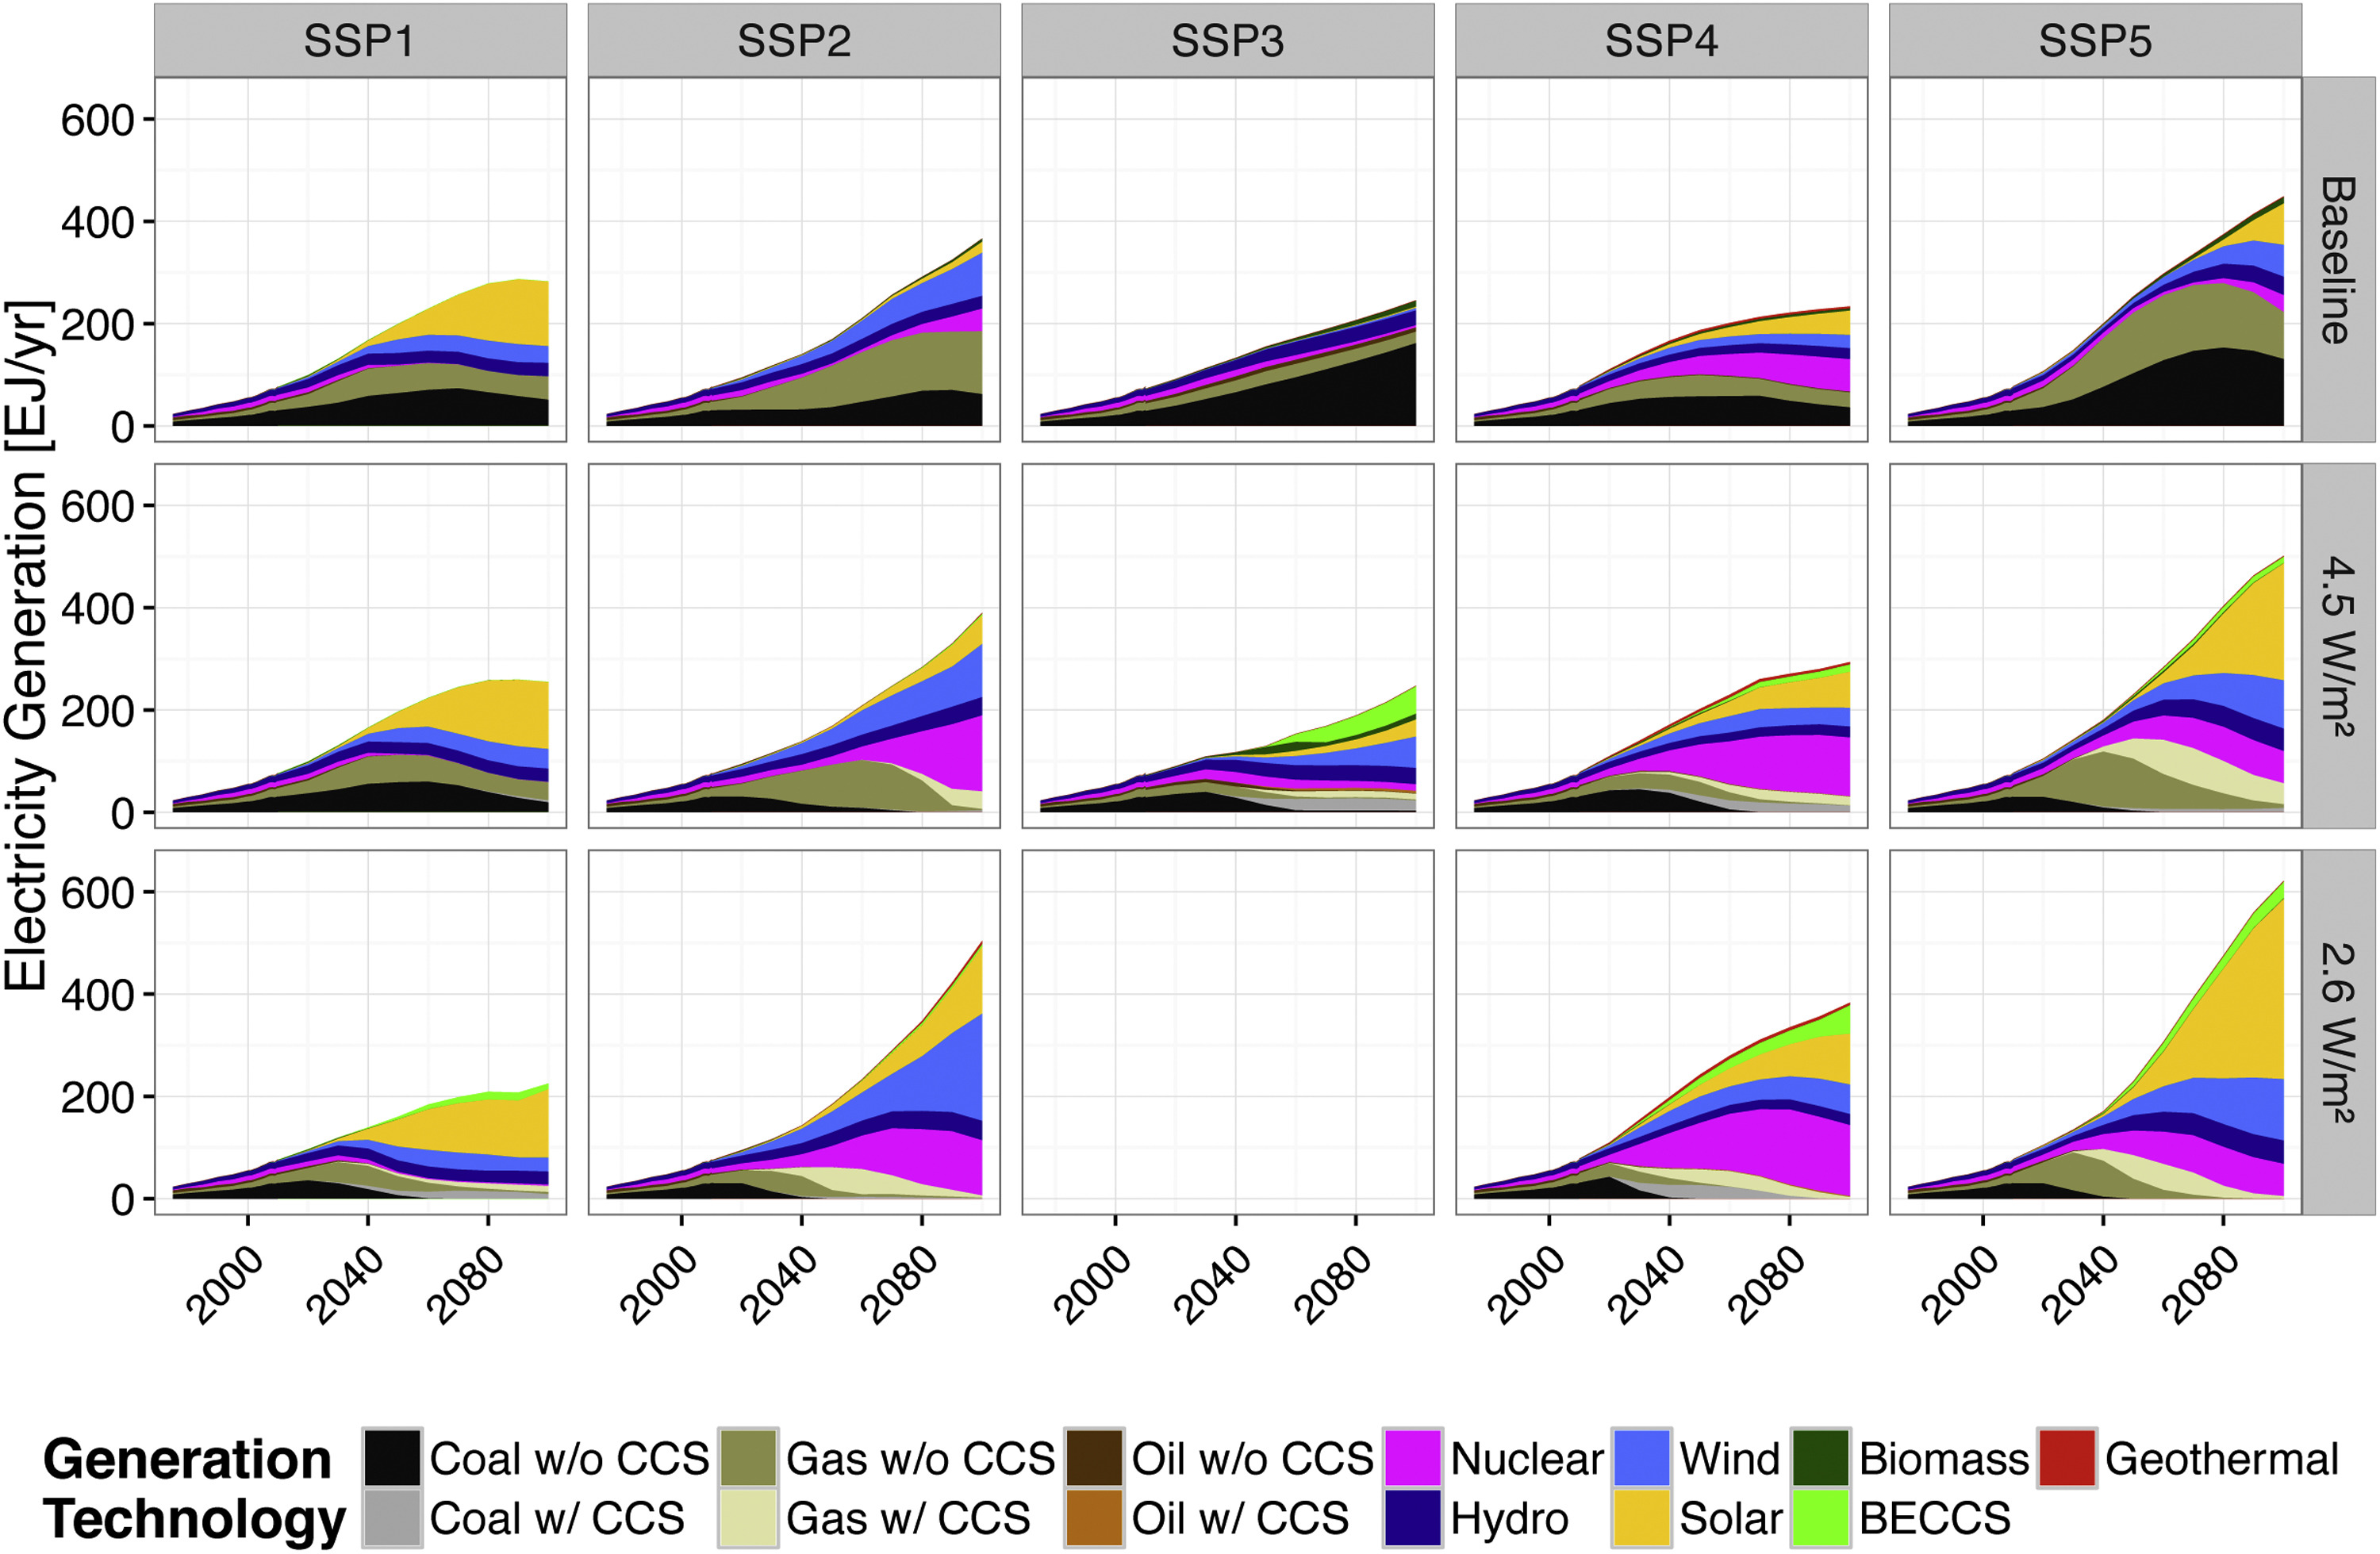
Source: Bauer et al (2017)1, Fig. 7
Global transport sector energy demand mix across SSPs and climate policy cases
![]()
Source: Bauer et al (2017)2, Fig. S13
Global production mix of liquid fuels by technology and primary energy source
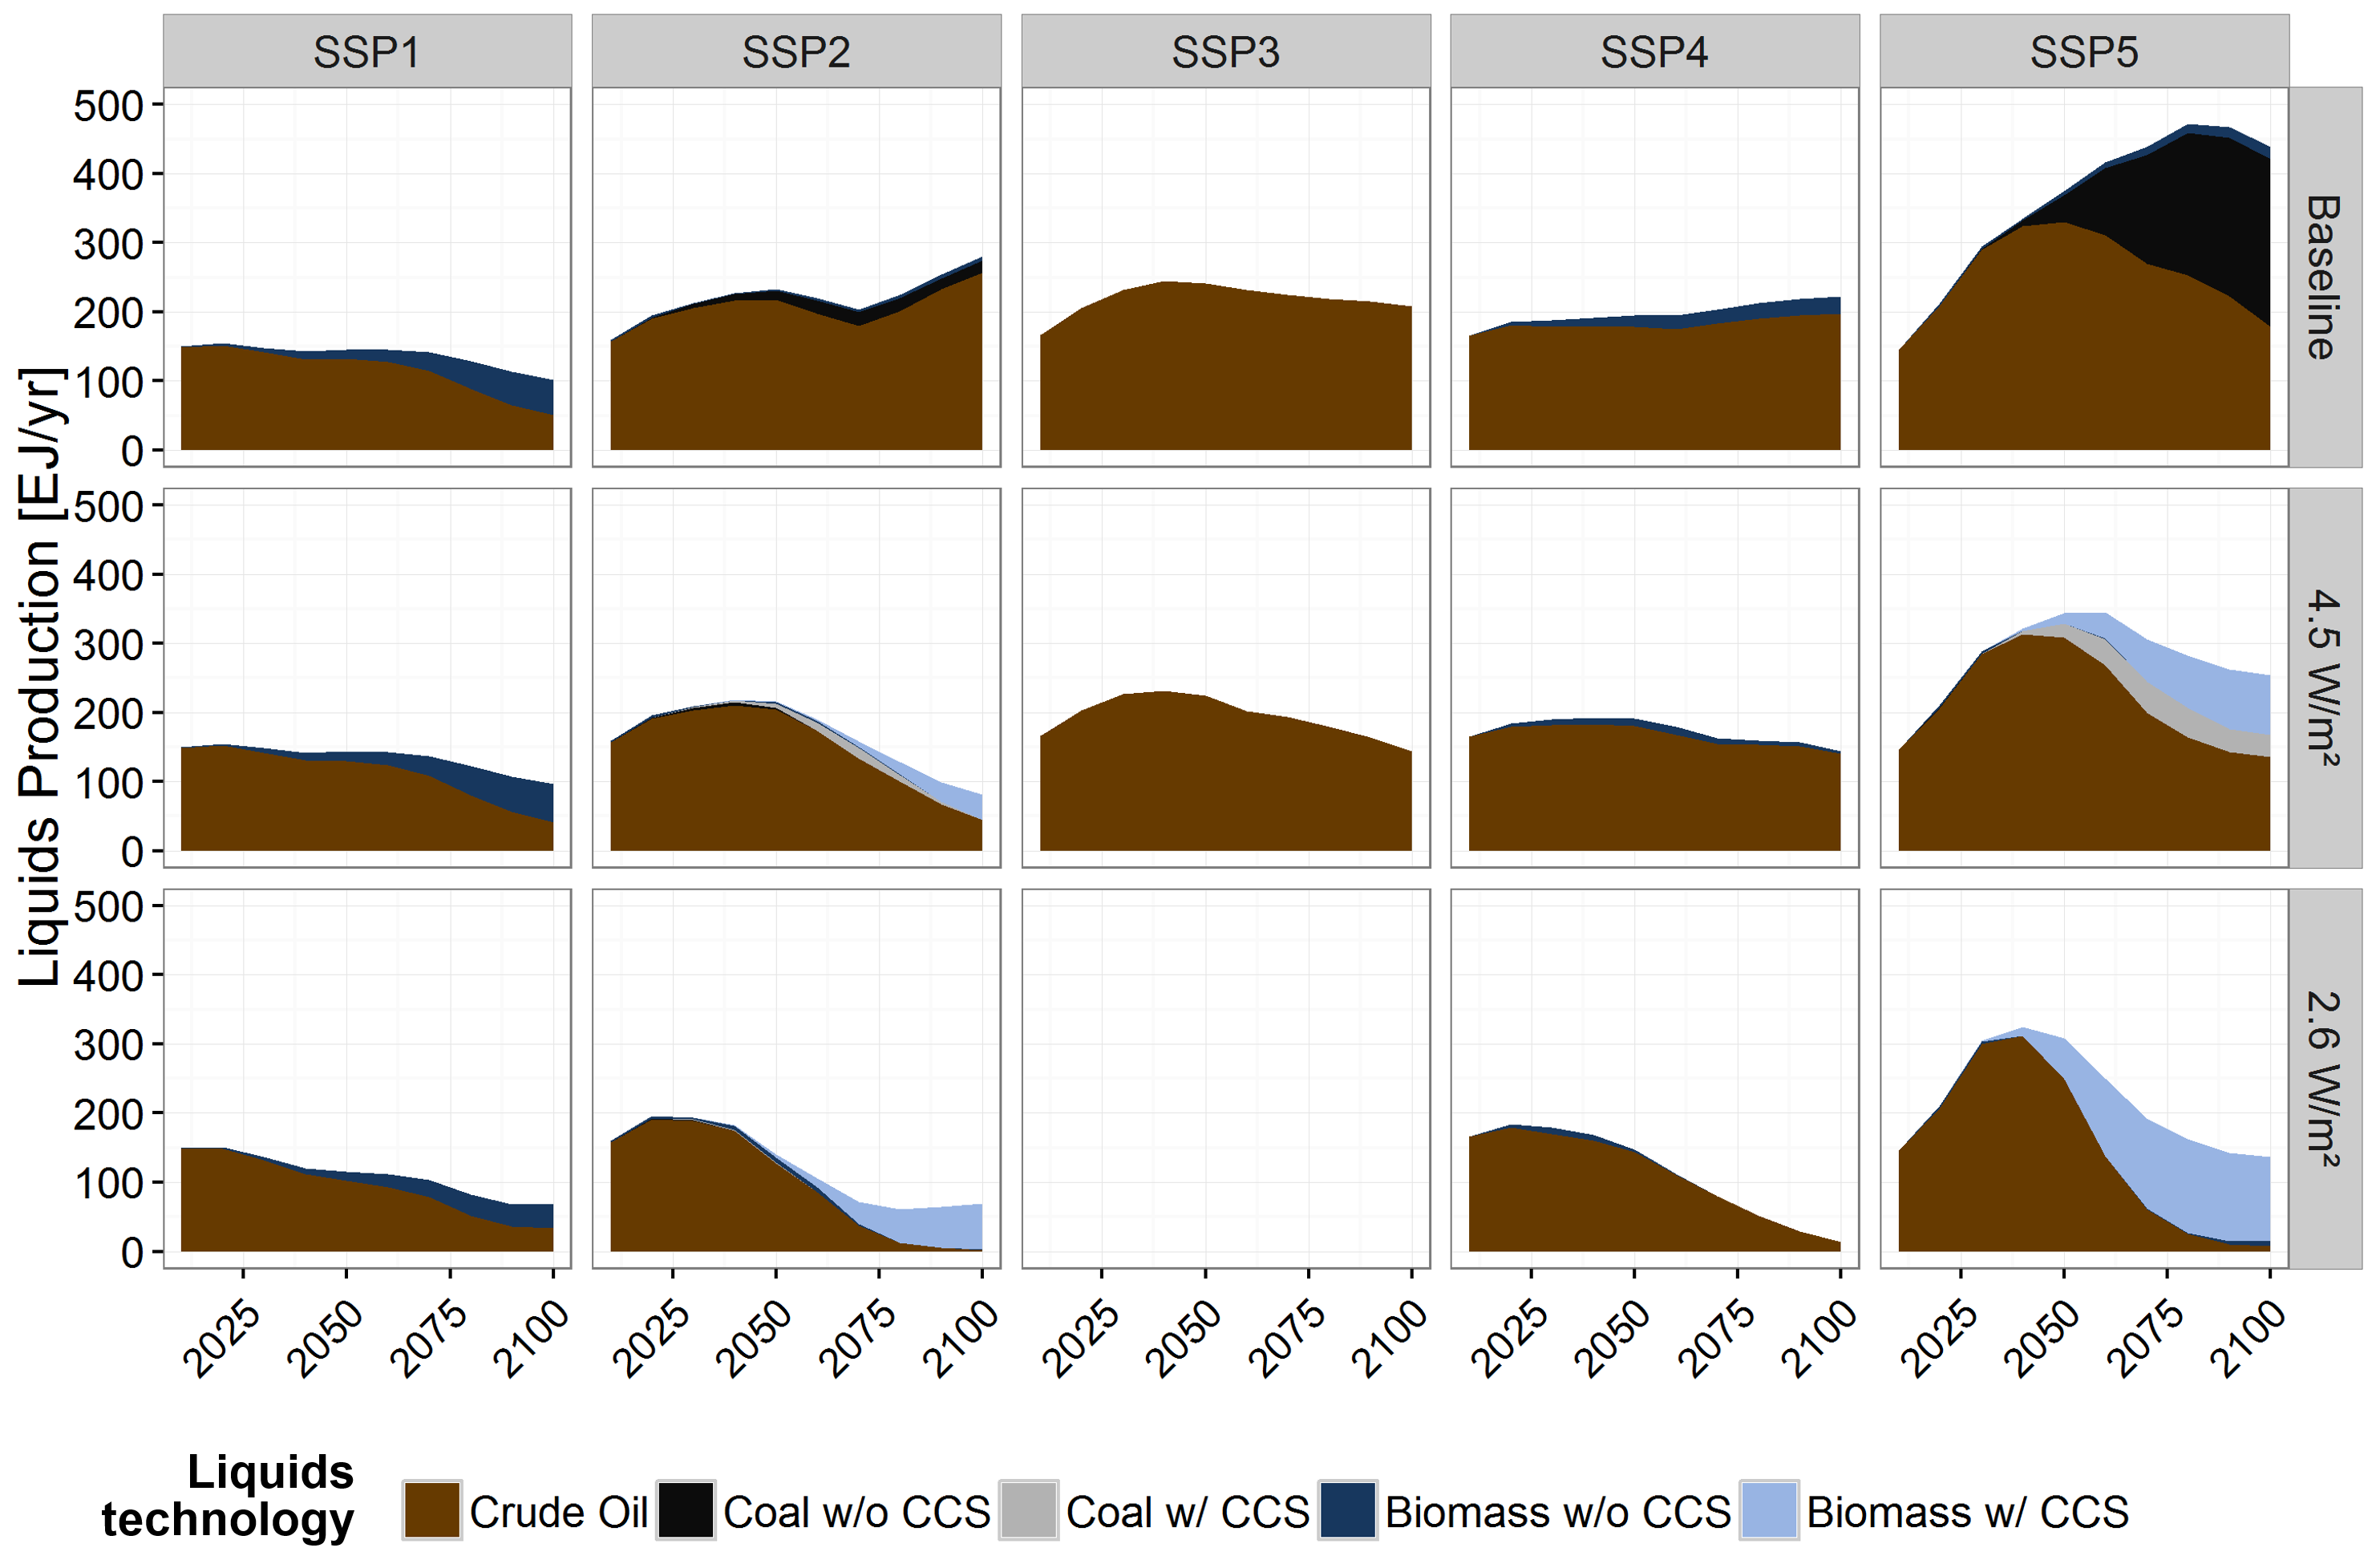
Source: Bauer et al (2017)2, Fig. S14
Global mix of bio-fuel production from bio-energy differentiated by secondary energy carrier
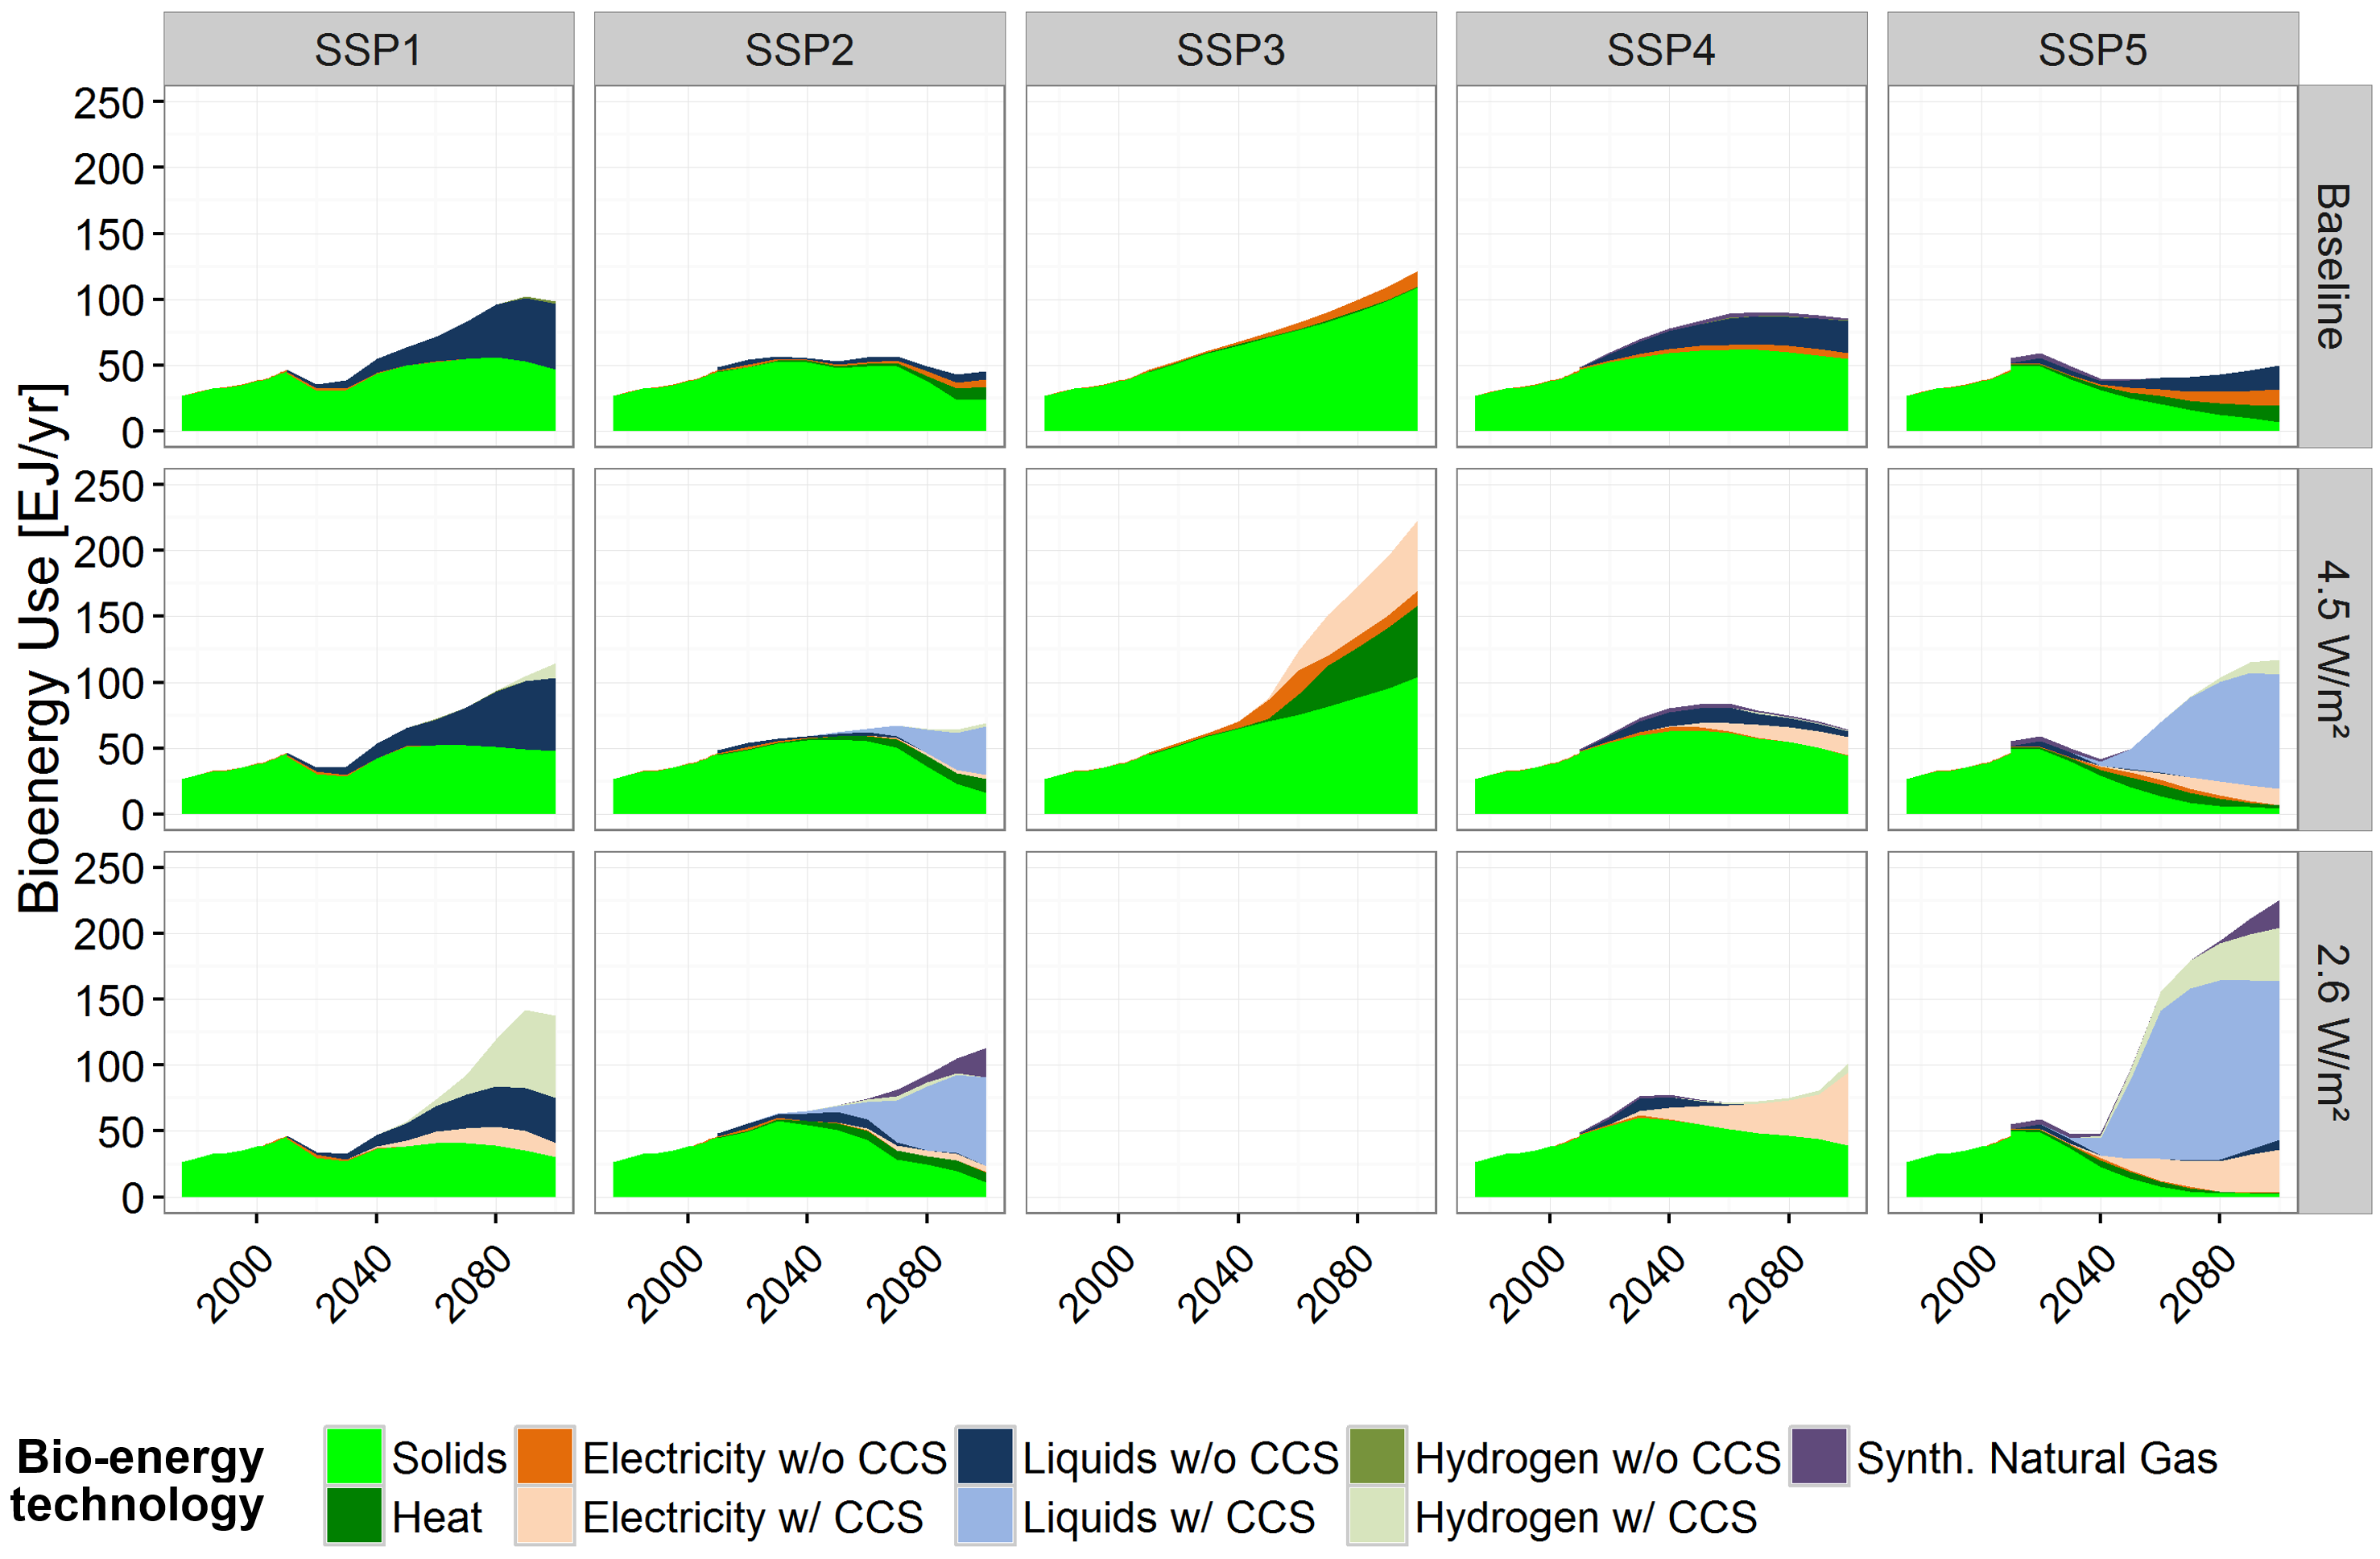
Source: Bauer et al (2017)2, Fig. S15
IPCC scenarios for 1.5°C warming (1.9 W/m2 forcing)
Cumulative CO2 emissions for four 1.5°C-consistent pathway archetypes
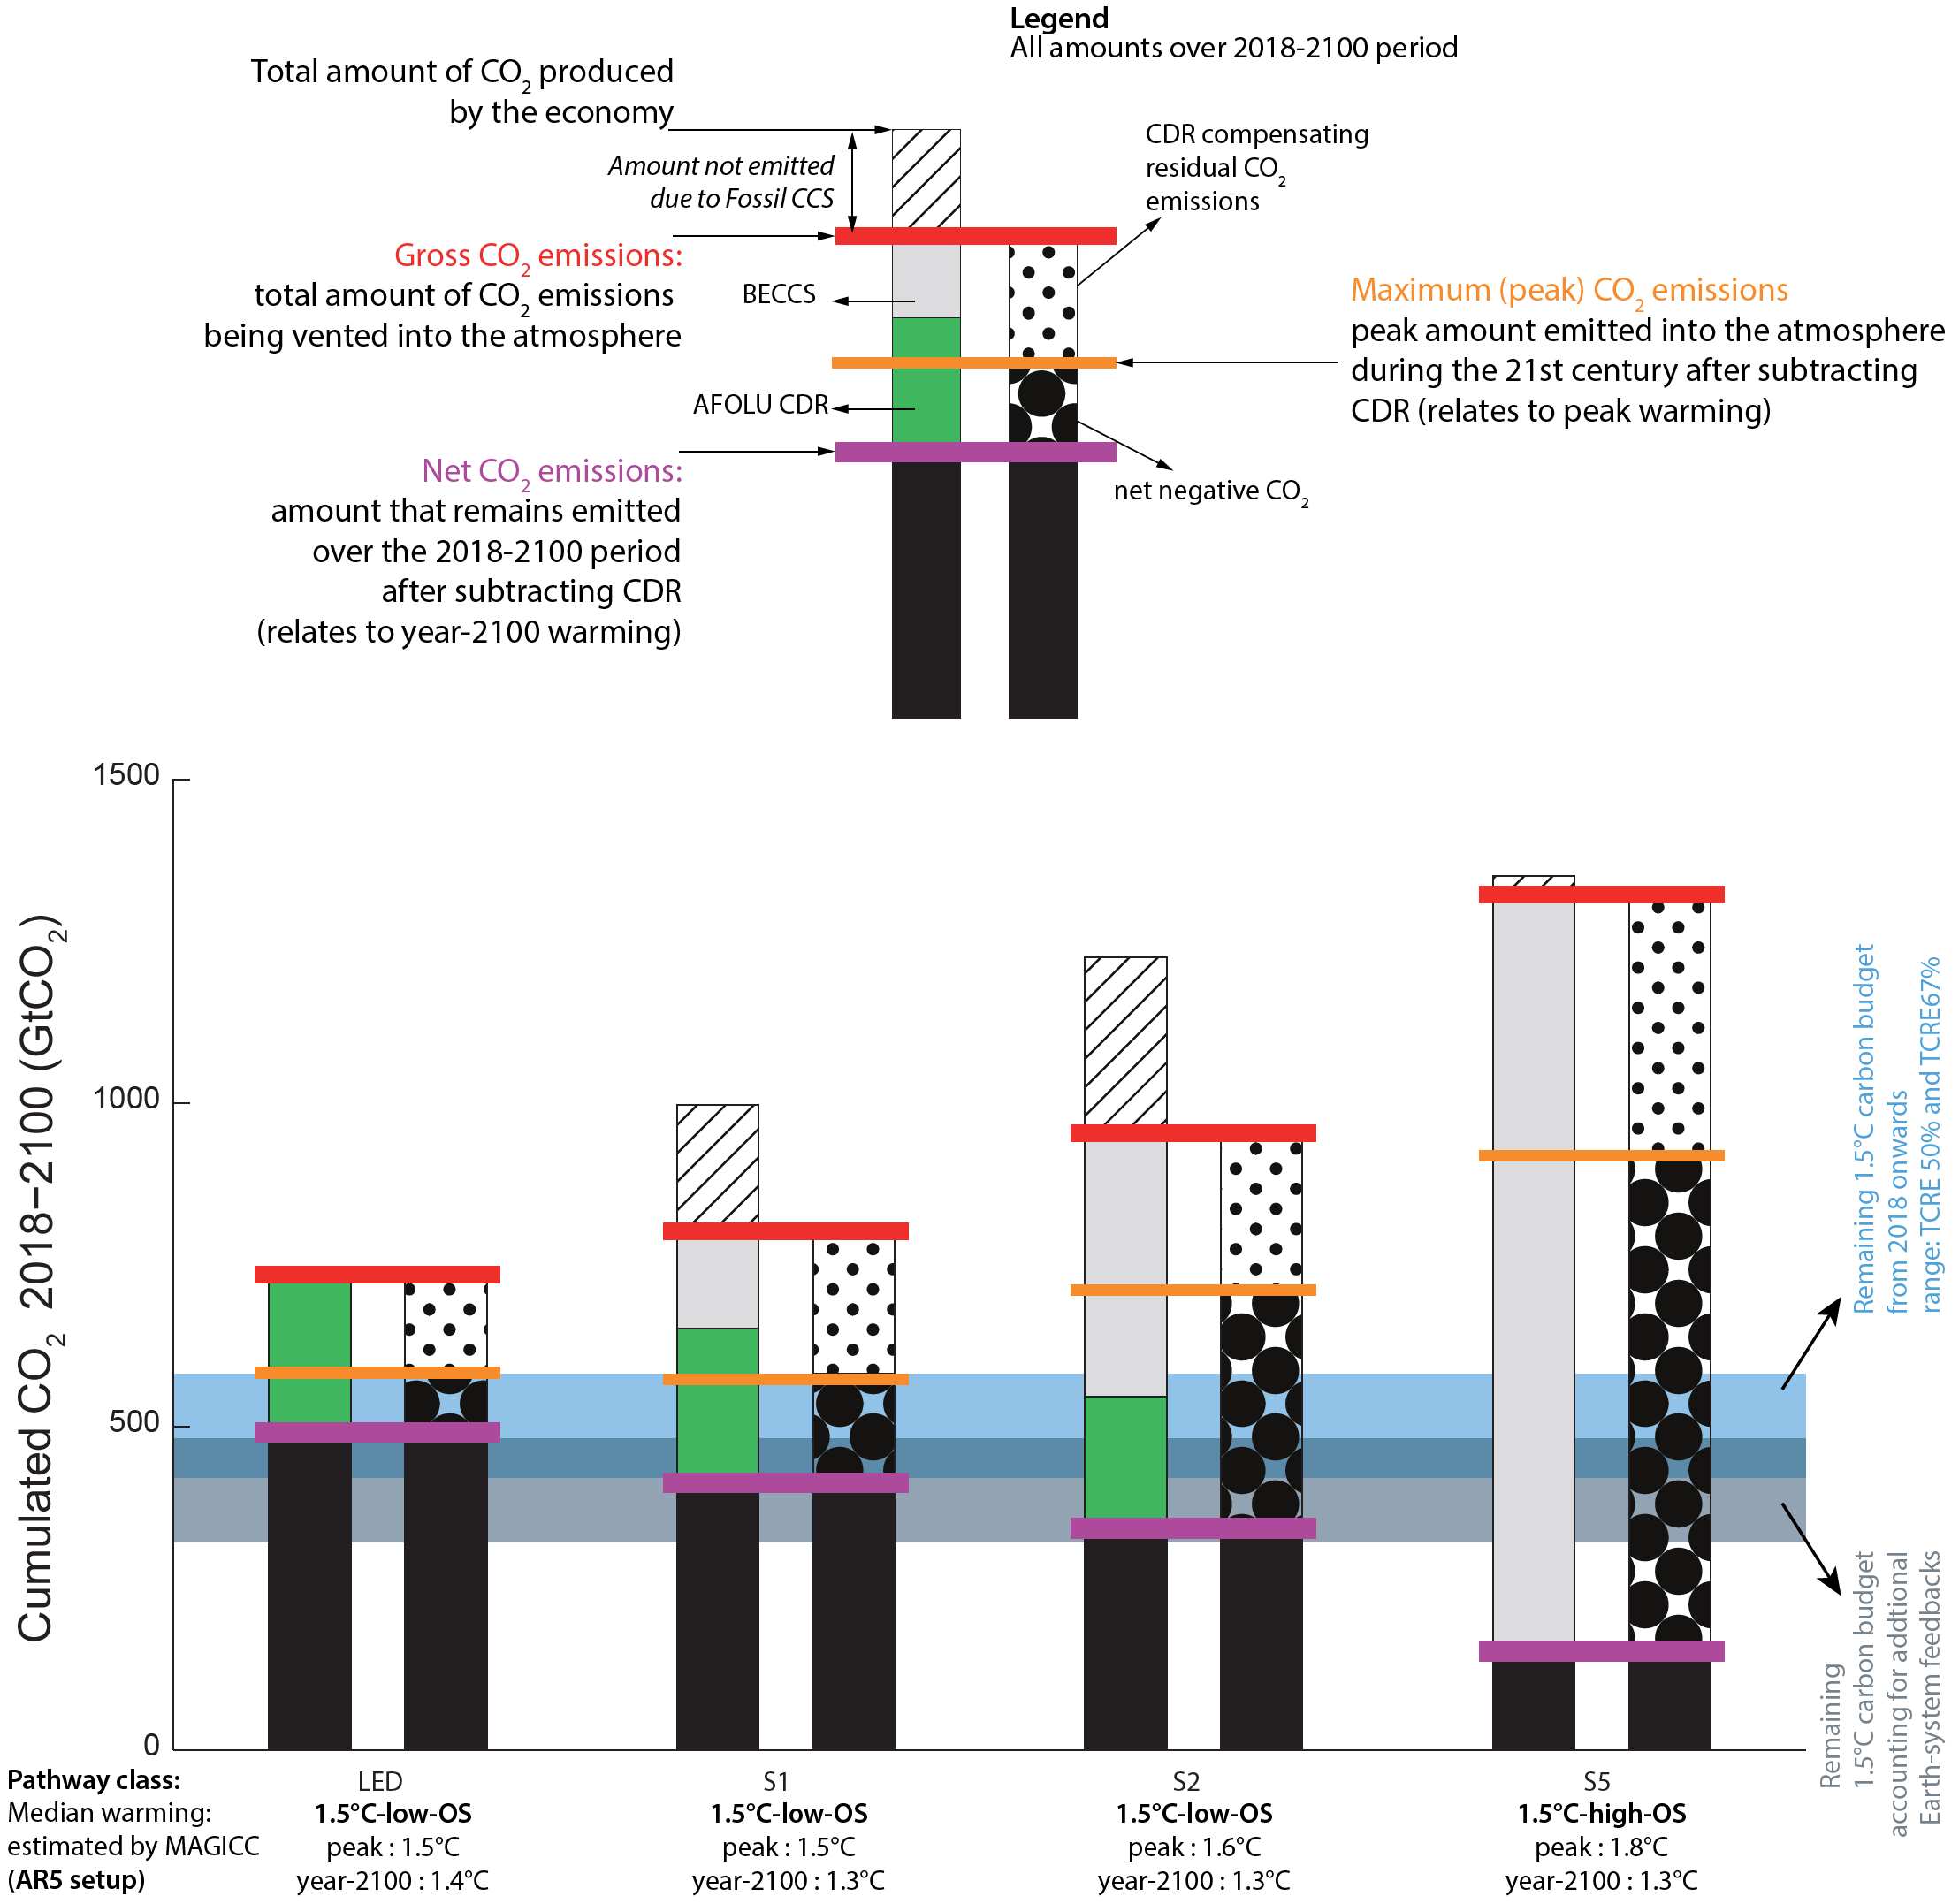
Source: IPCC (2018) SR153, Fig. 2.10 (rearranged)
‘Low OS’ is ‘low overshoot’, and ‘high OS’ involves overshooting 1.5°C and stabilisation at a later stage.
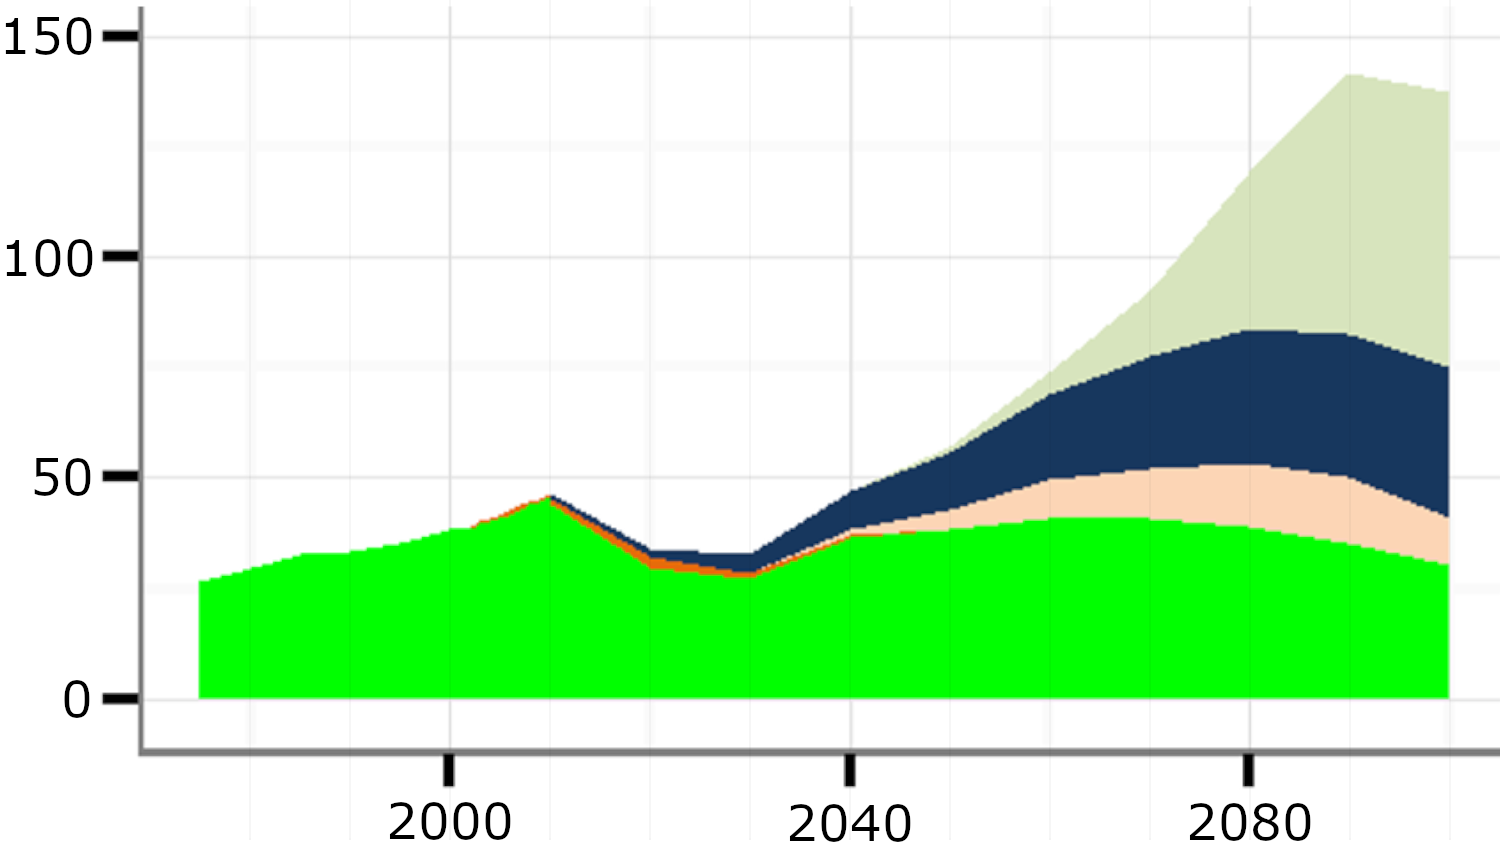
Evolution and break down of global anthropogenic CO2 emissions until 2100
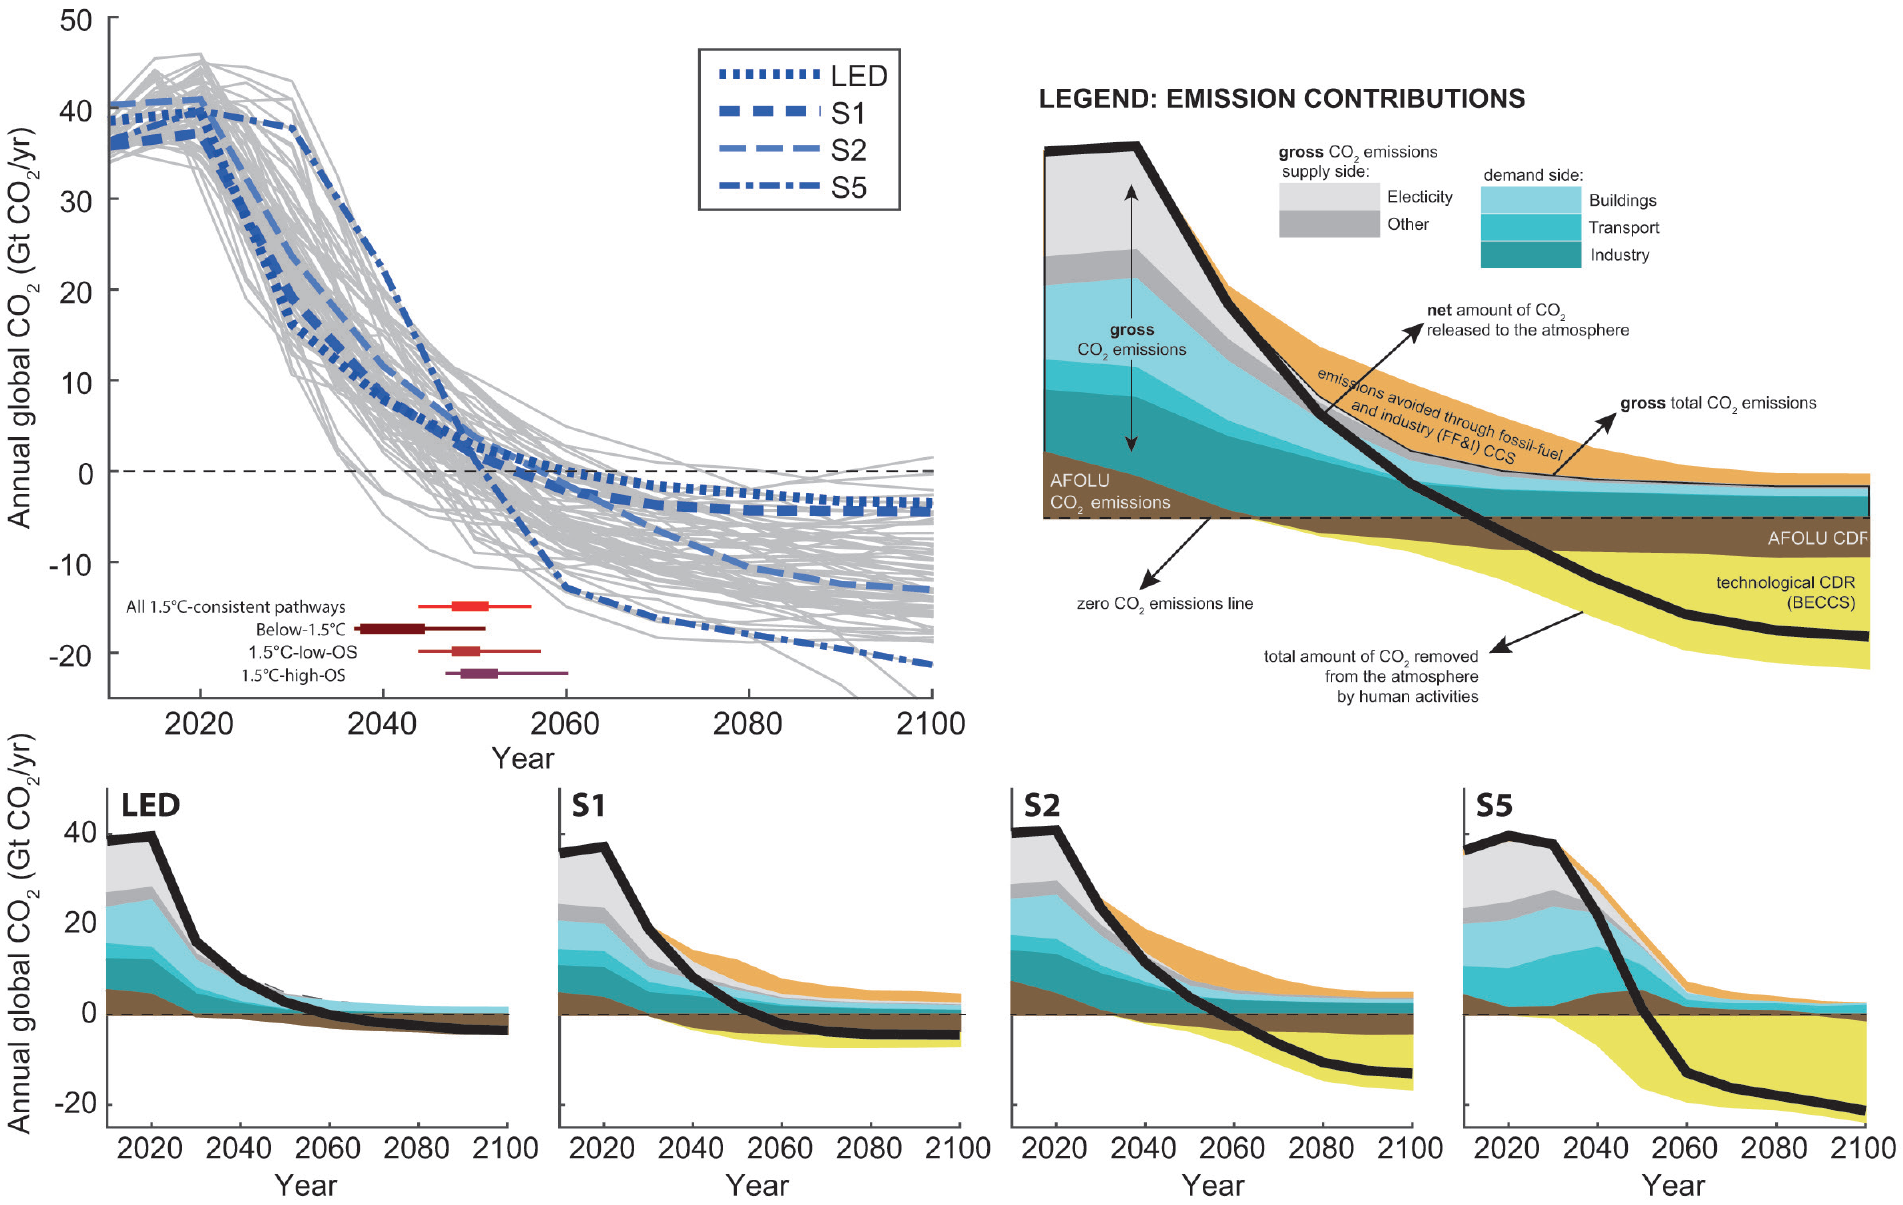
Source: IPCC (2018) SR153, Fig. 2.5
“Note that the S5 scenario reports the building and industry sector emissions jointly. Green-blue areas hence show emissions from the transport sector and the joint building and industry demand sector, respectively.”
Source: IPCC (2018) SR153, Fig. 2.5
Characteristics of four illustrative pathways for warming of 1.5°C
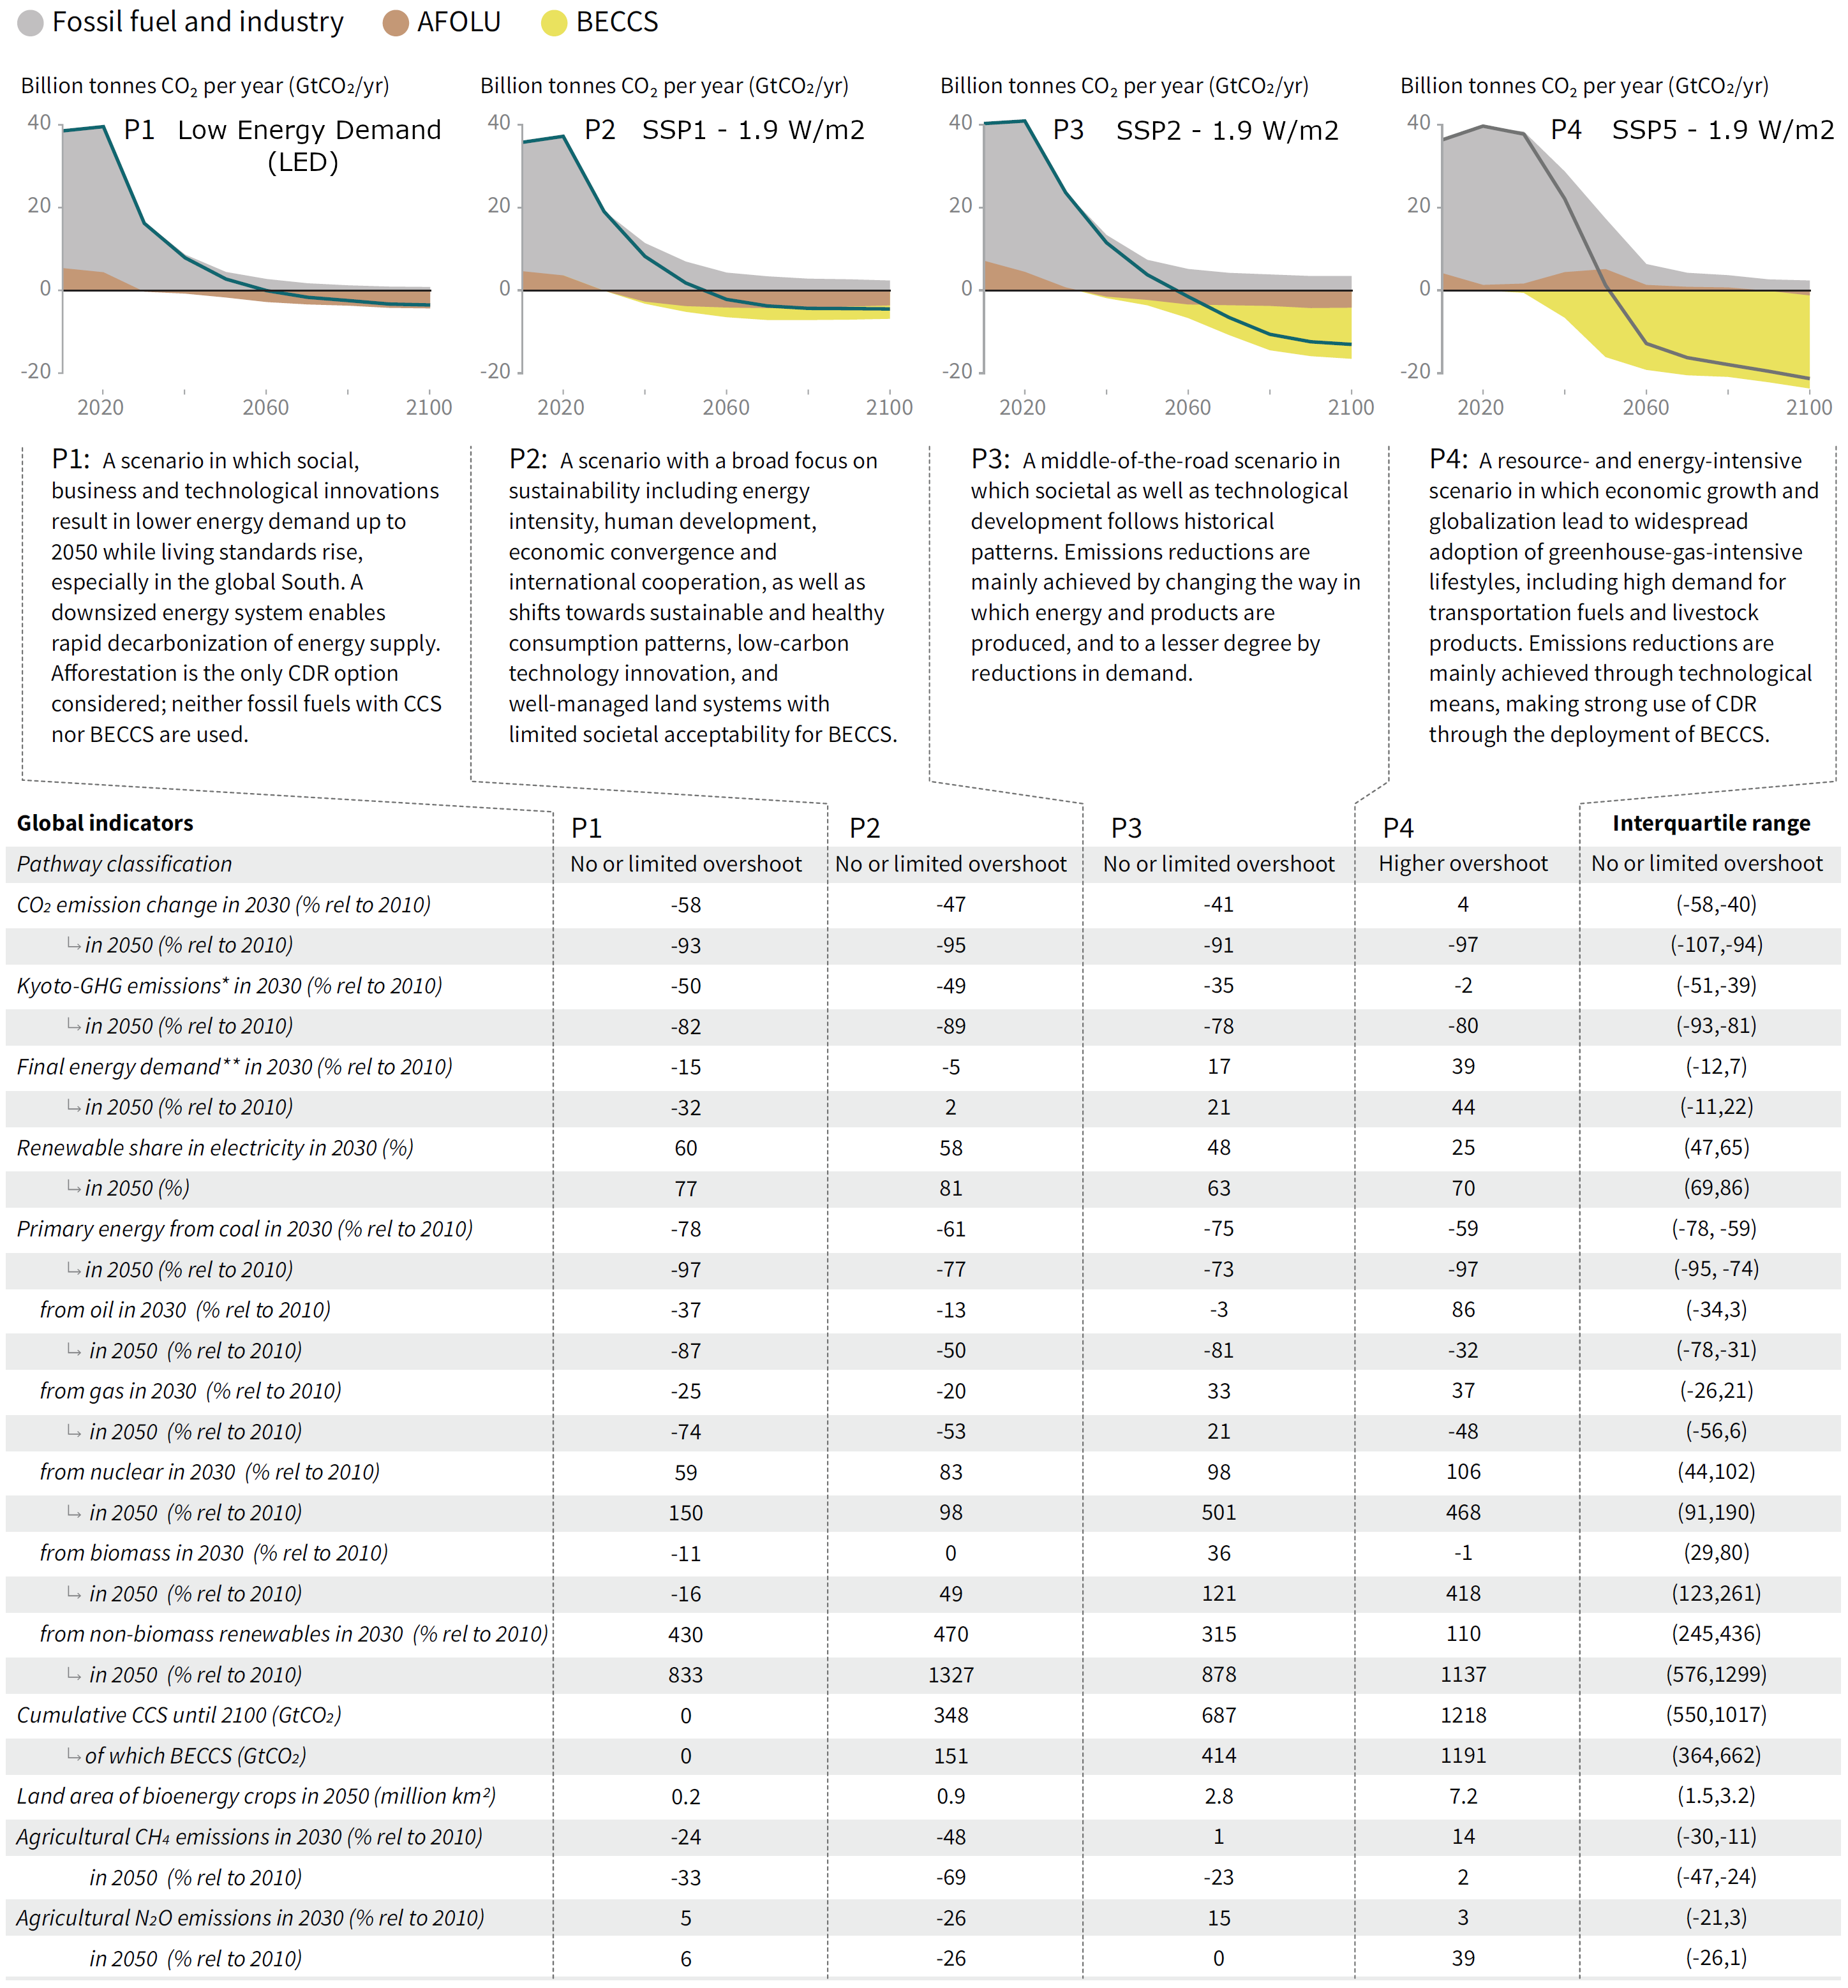
Source: IPCC (2018) Summary for policymakers – SR154, Fig. SPM.3b
The four scenarios above (P1, P2, P3, P4) correspond to the four scenarios (LED, S1, S2, S5)
- P1 : LED – Low energy demand scenario
- P2 : S1 – Sustainability (SSP1)
- P3 : S2 – Middle of the road (SSP2)
- P4 : S5 – Fossil-fuel intensive (SSP5)
Primary energy supply and Electricity generation for four 1.5°C-consistent pathways plus the IEA’s Faster Transition Scenario
![]()
![]()
Source: IPCC (2018) SR153, Fig. 2.15a & Fig. 2.16a
Shell’s decarbonisation scenarios
World energy-related CO2 emissions
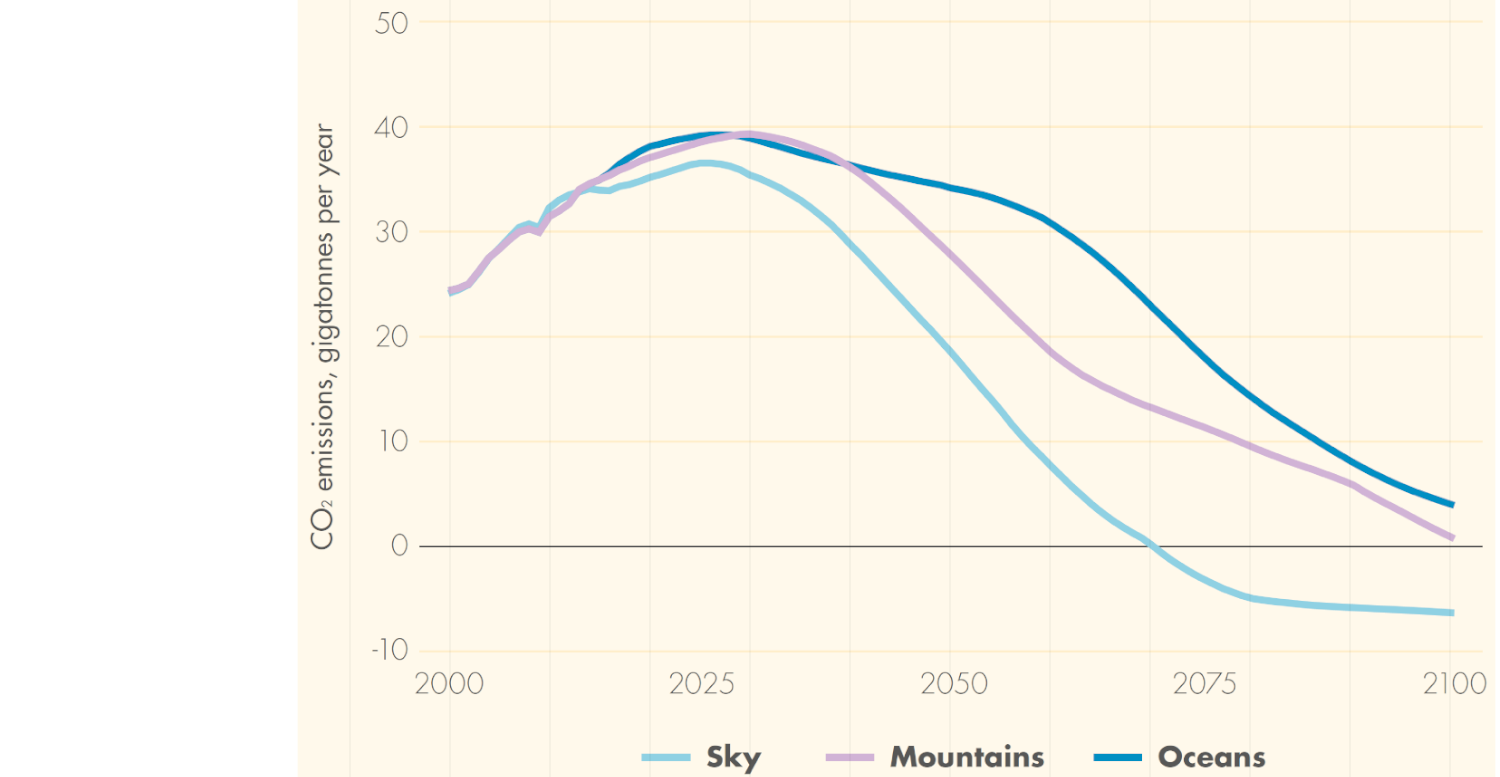
Source: Shell (2018)7, pg. 20
World total anthropogenic GHG emissions (GtCO2e/yr) in Shell scenarios
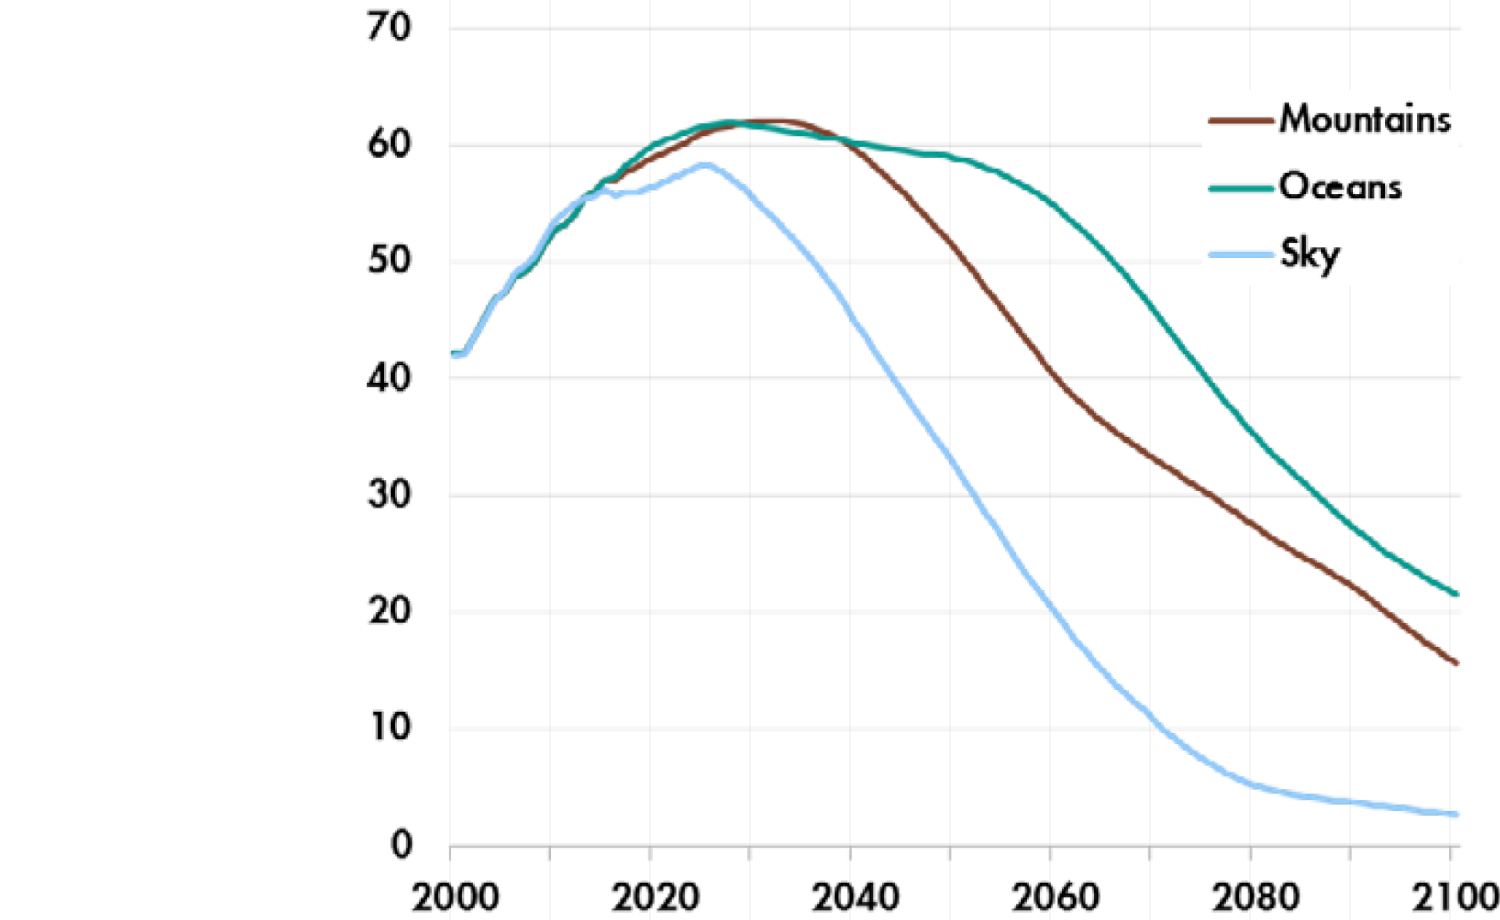
Source: Paltsev et al (2018)10, Fig. 2
Contribution of different anthropogenic GHGs to the global total (GtCO2e/yr) in Shell’s Sky scenario
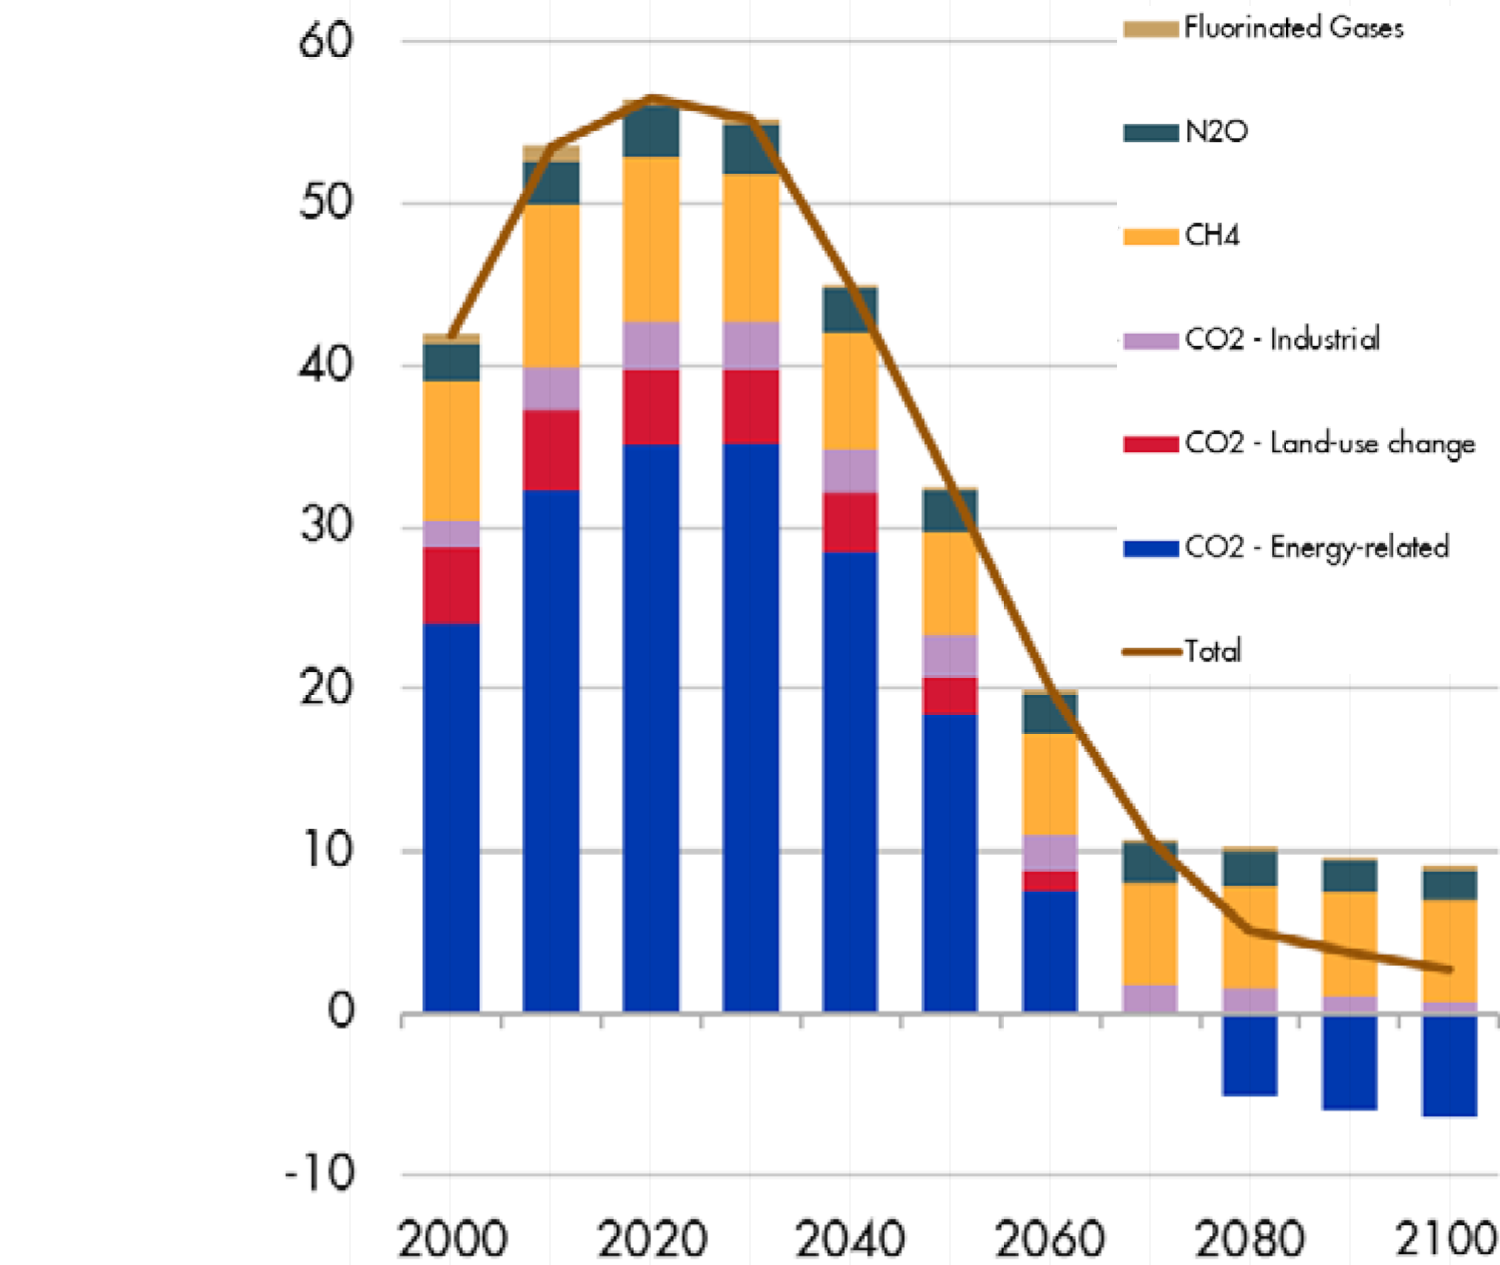
Source: Paltsev et al (2018)10, Fig. 1
Global average surface air temperature change relative to the preindustrial level of 1861–1880 (C°)
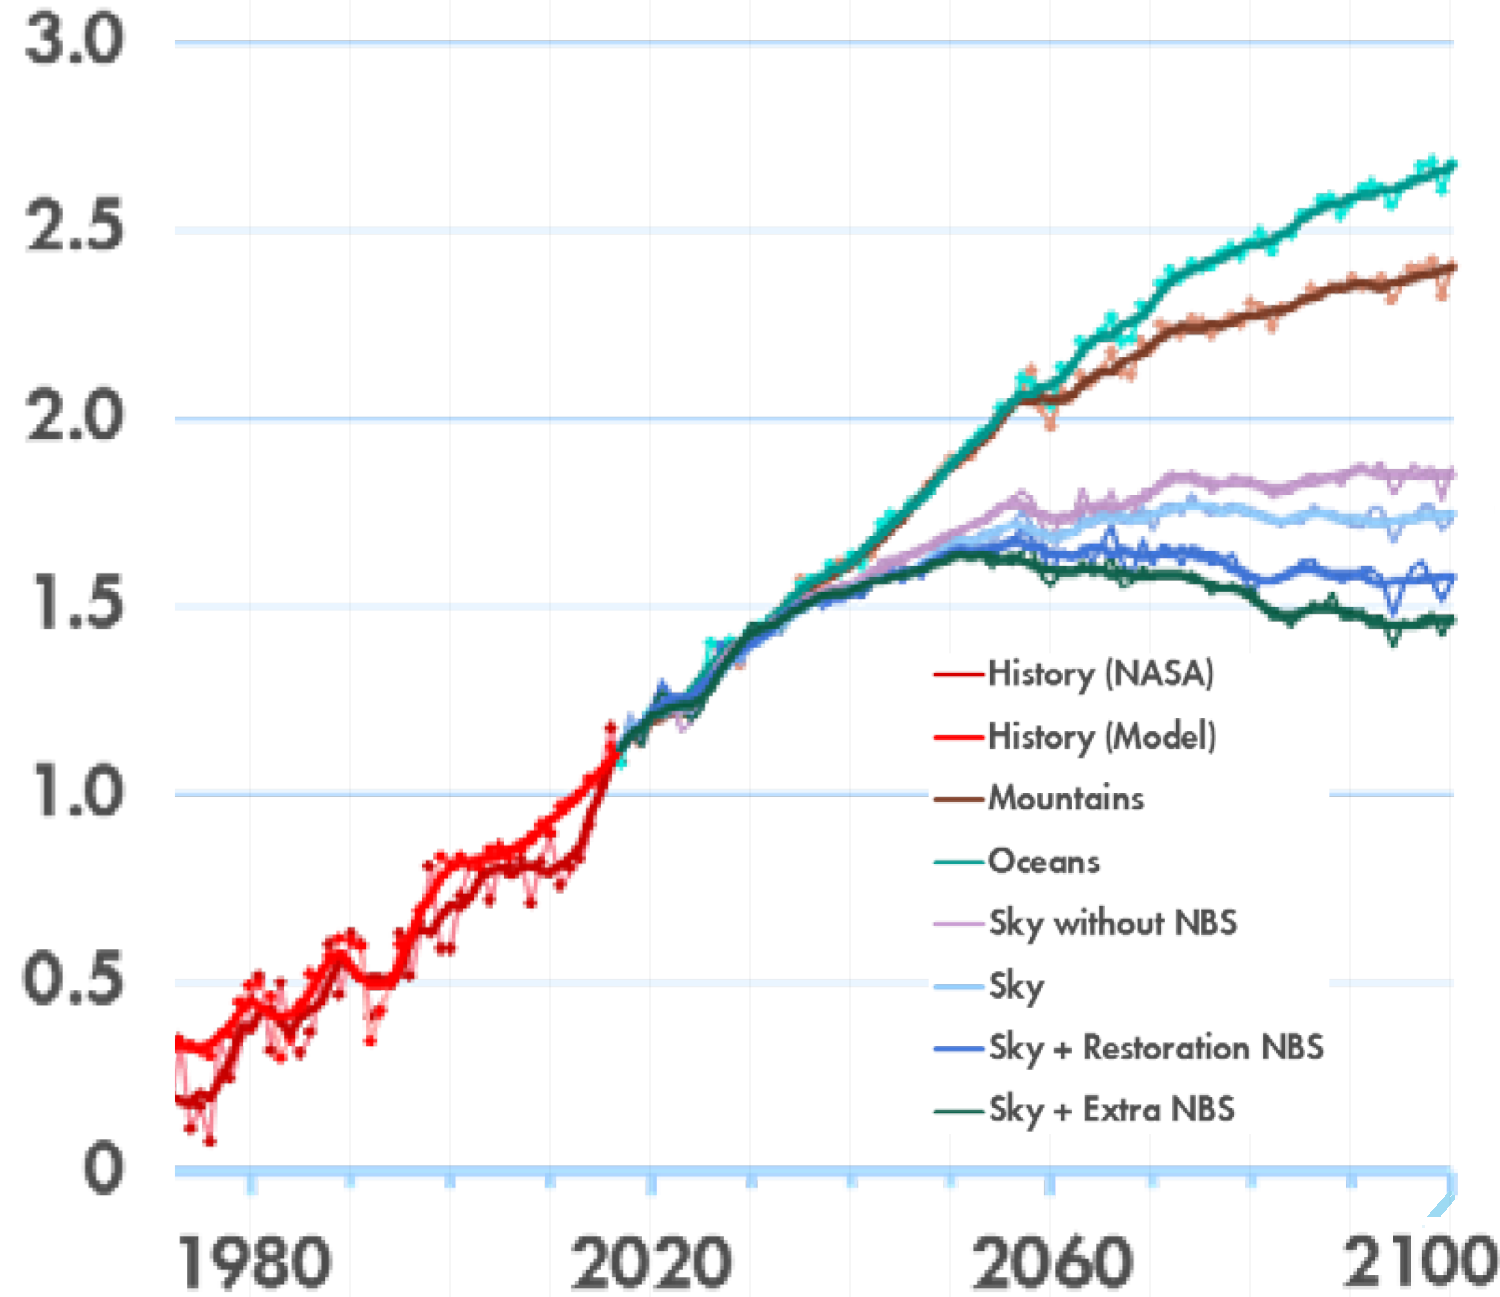
Source: Paltsev et al (2018)10, Fig. 14 (modified)
Where NBS is ‘nature-based solutions’. See Griscom et al (2017)11 for a discussion of the potential of ‘natural climate solutions’.
Primary energy by source in Shell’s scenarios: Mountains, Oceans, and Sky
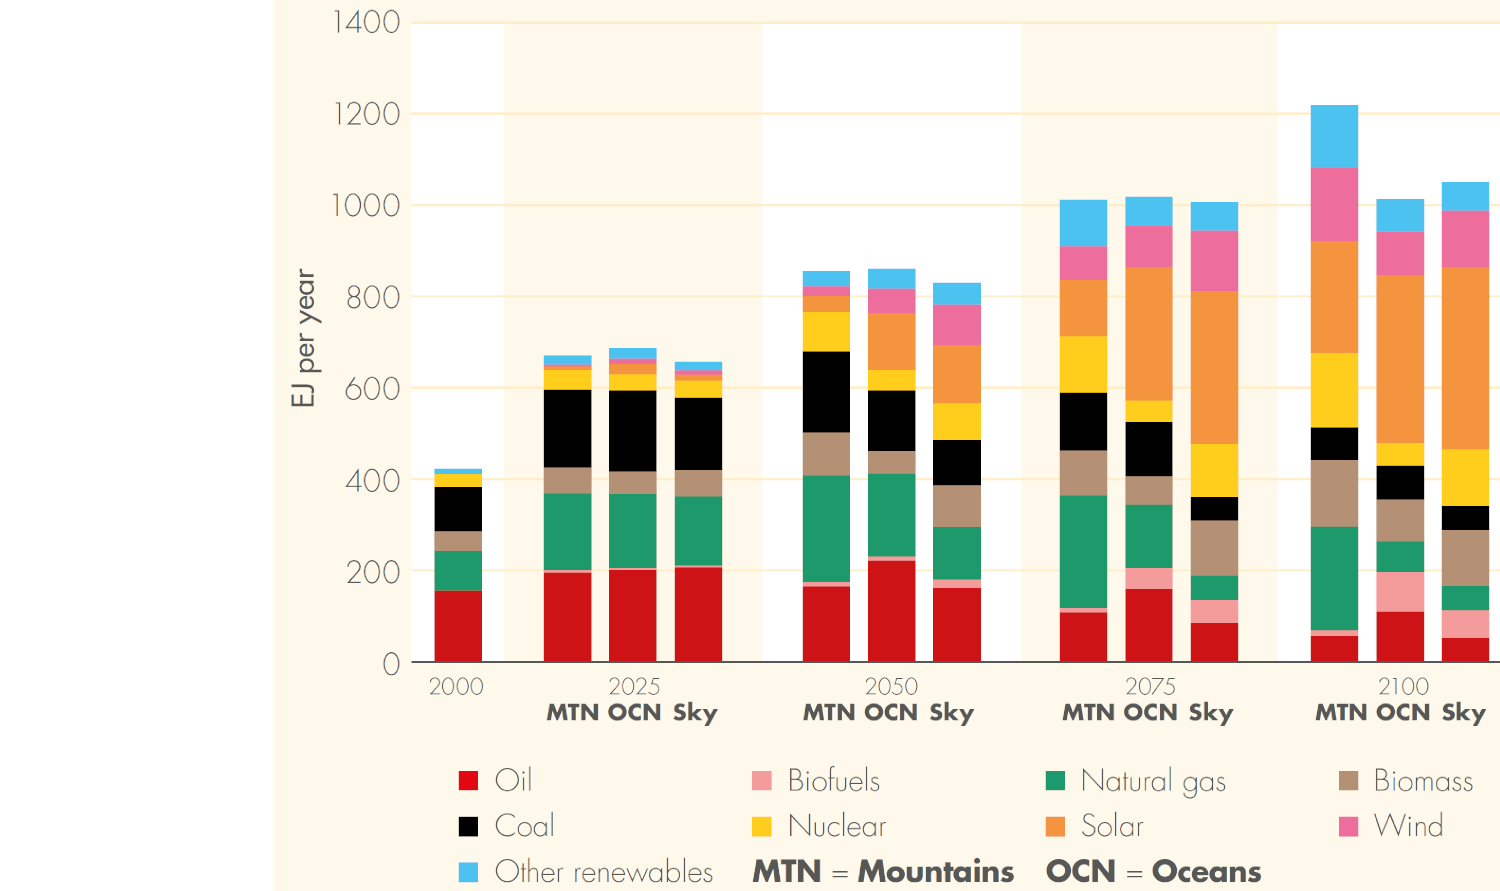
Source: Shell (2018)7, pg. 21
Global end energy-use consumption from Shell’s Sky scenario
Source: Shell (2018)8, pg. 4
DNV-GL’s Energy Transition Outlook 2018
Carbon emissions and budget

Source: DNV-GL (2018)13, Fig. 7.6
Overview of anthropogenic CO2 emissions in Gt/yr
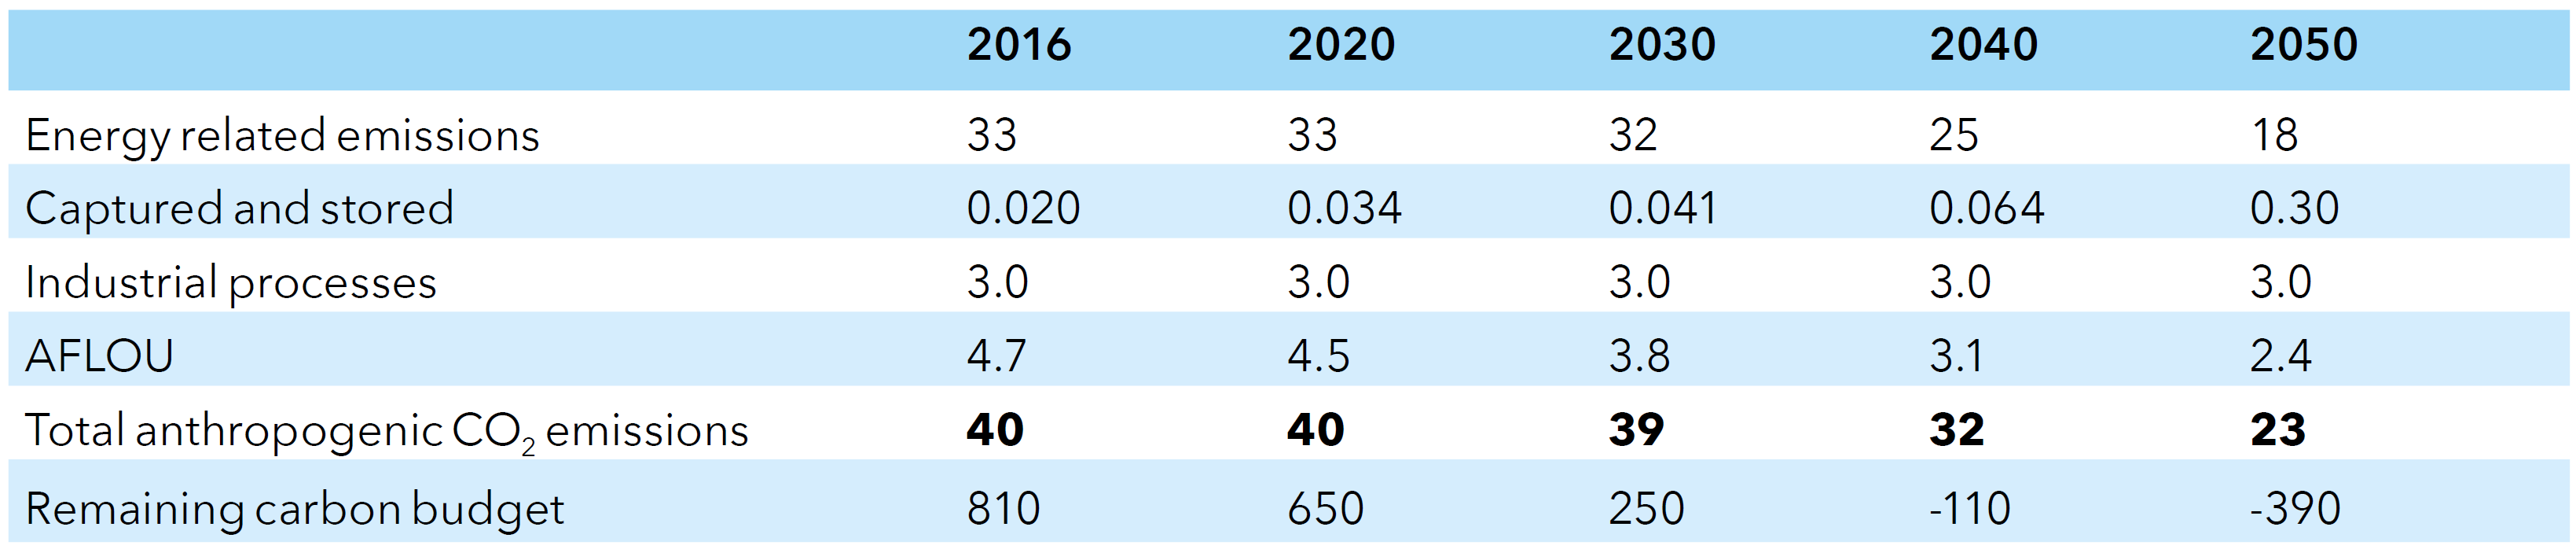
Source: DNV-GL (2018)13, Table 7.1
World energy-related CO2 emissions from fossil fuels
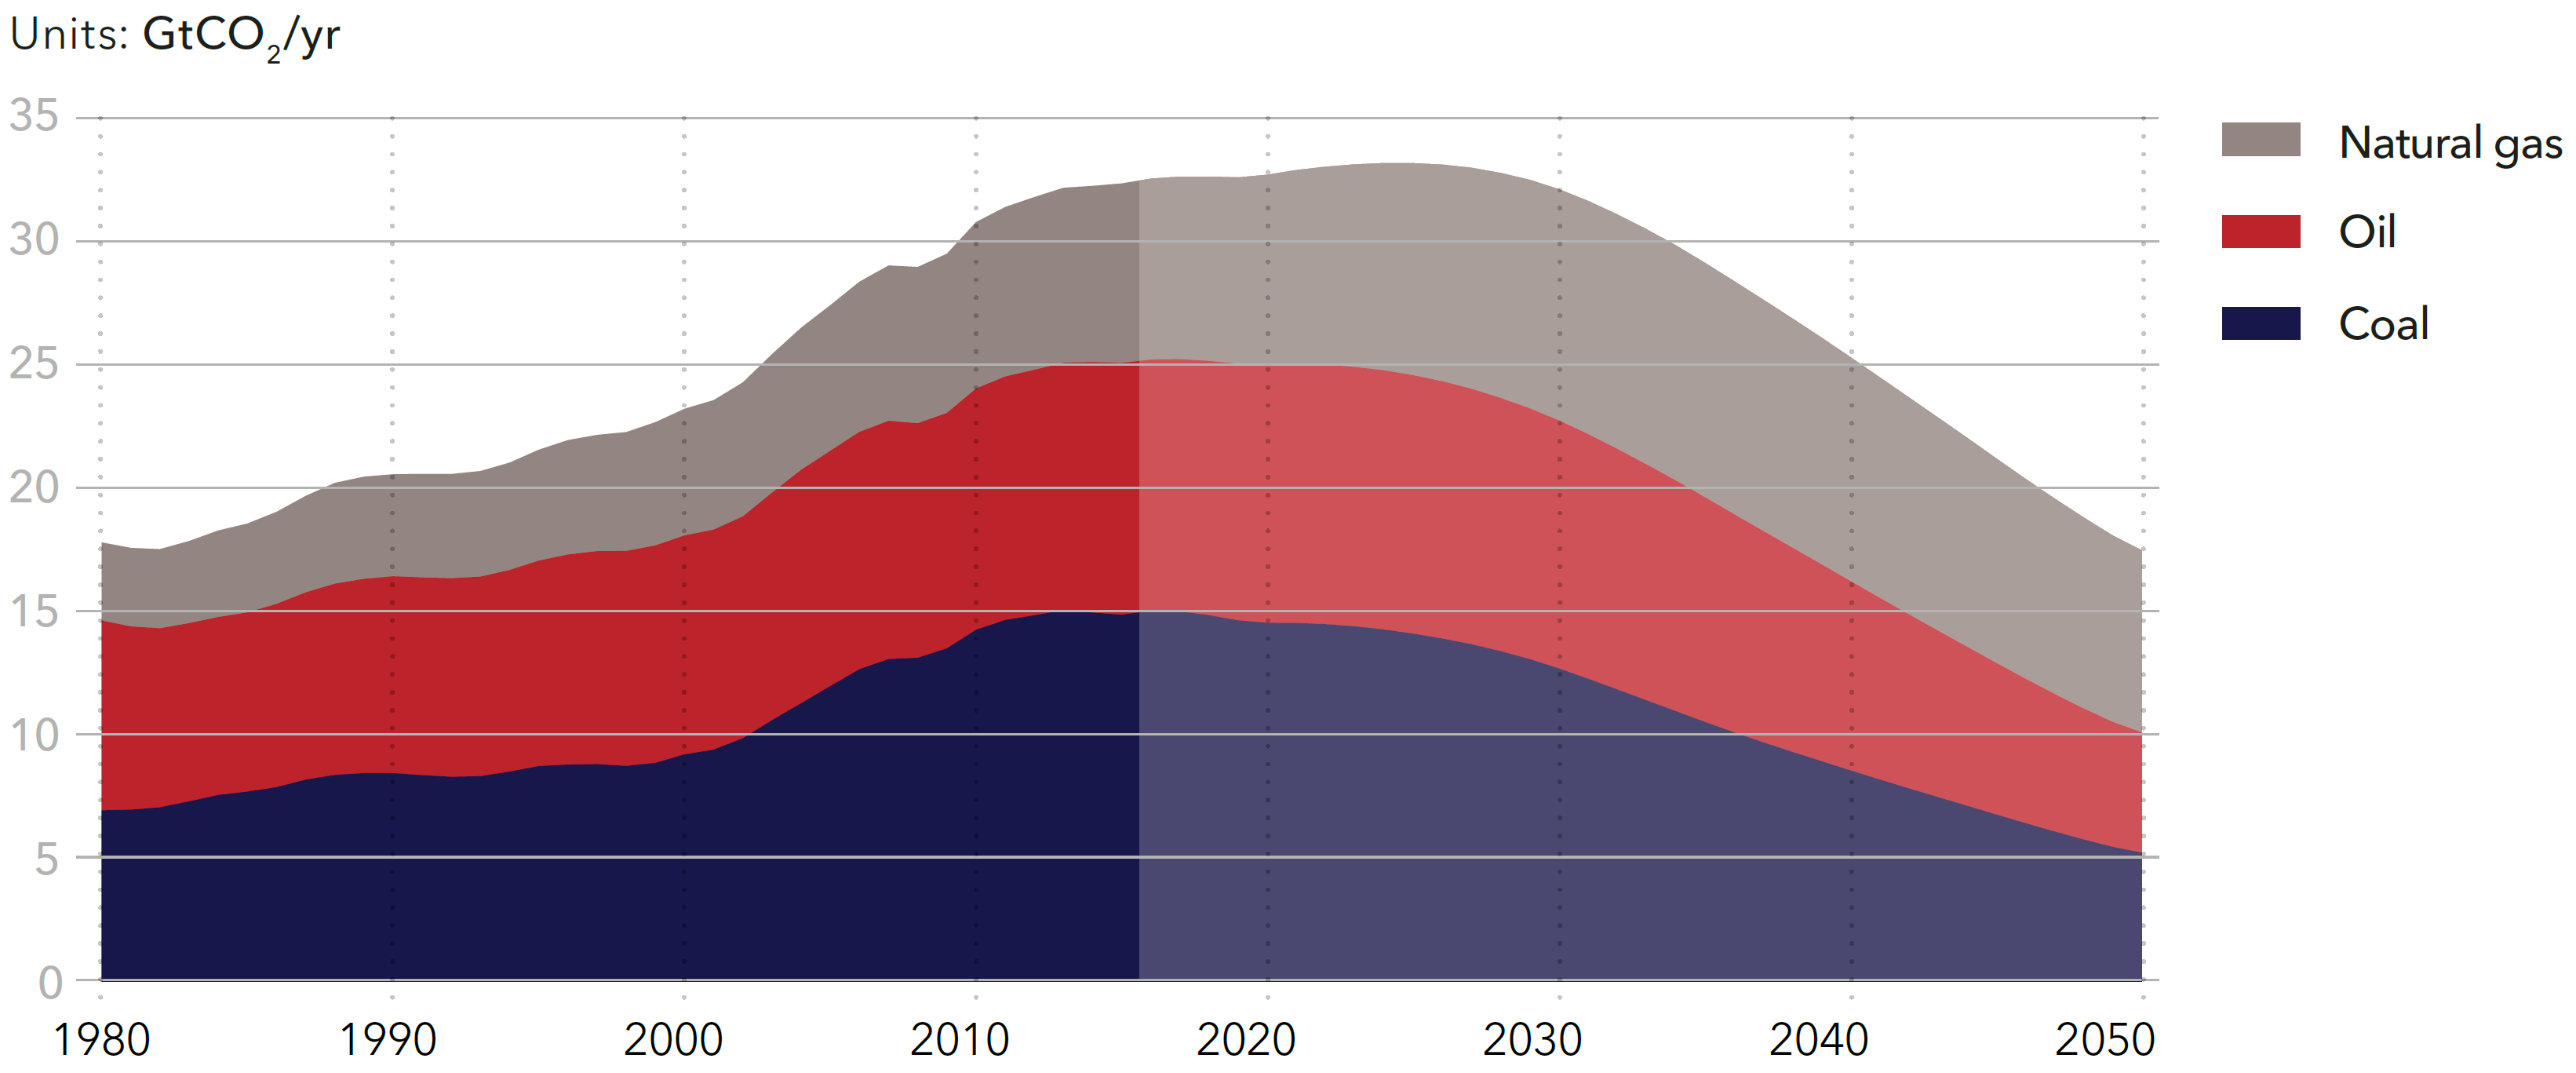
Source: DNV-GL (2018)13, Fig. 7.1
The decoupling of economic growth from other key parameters
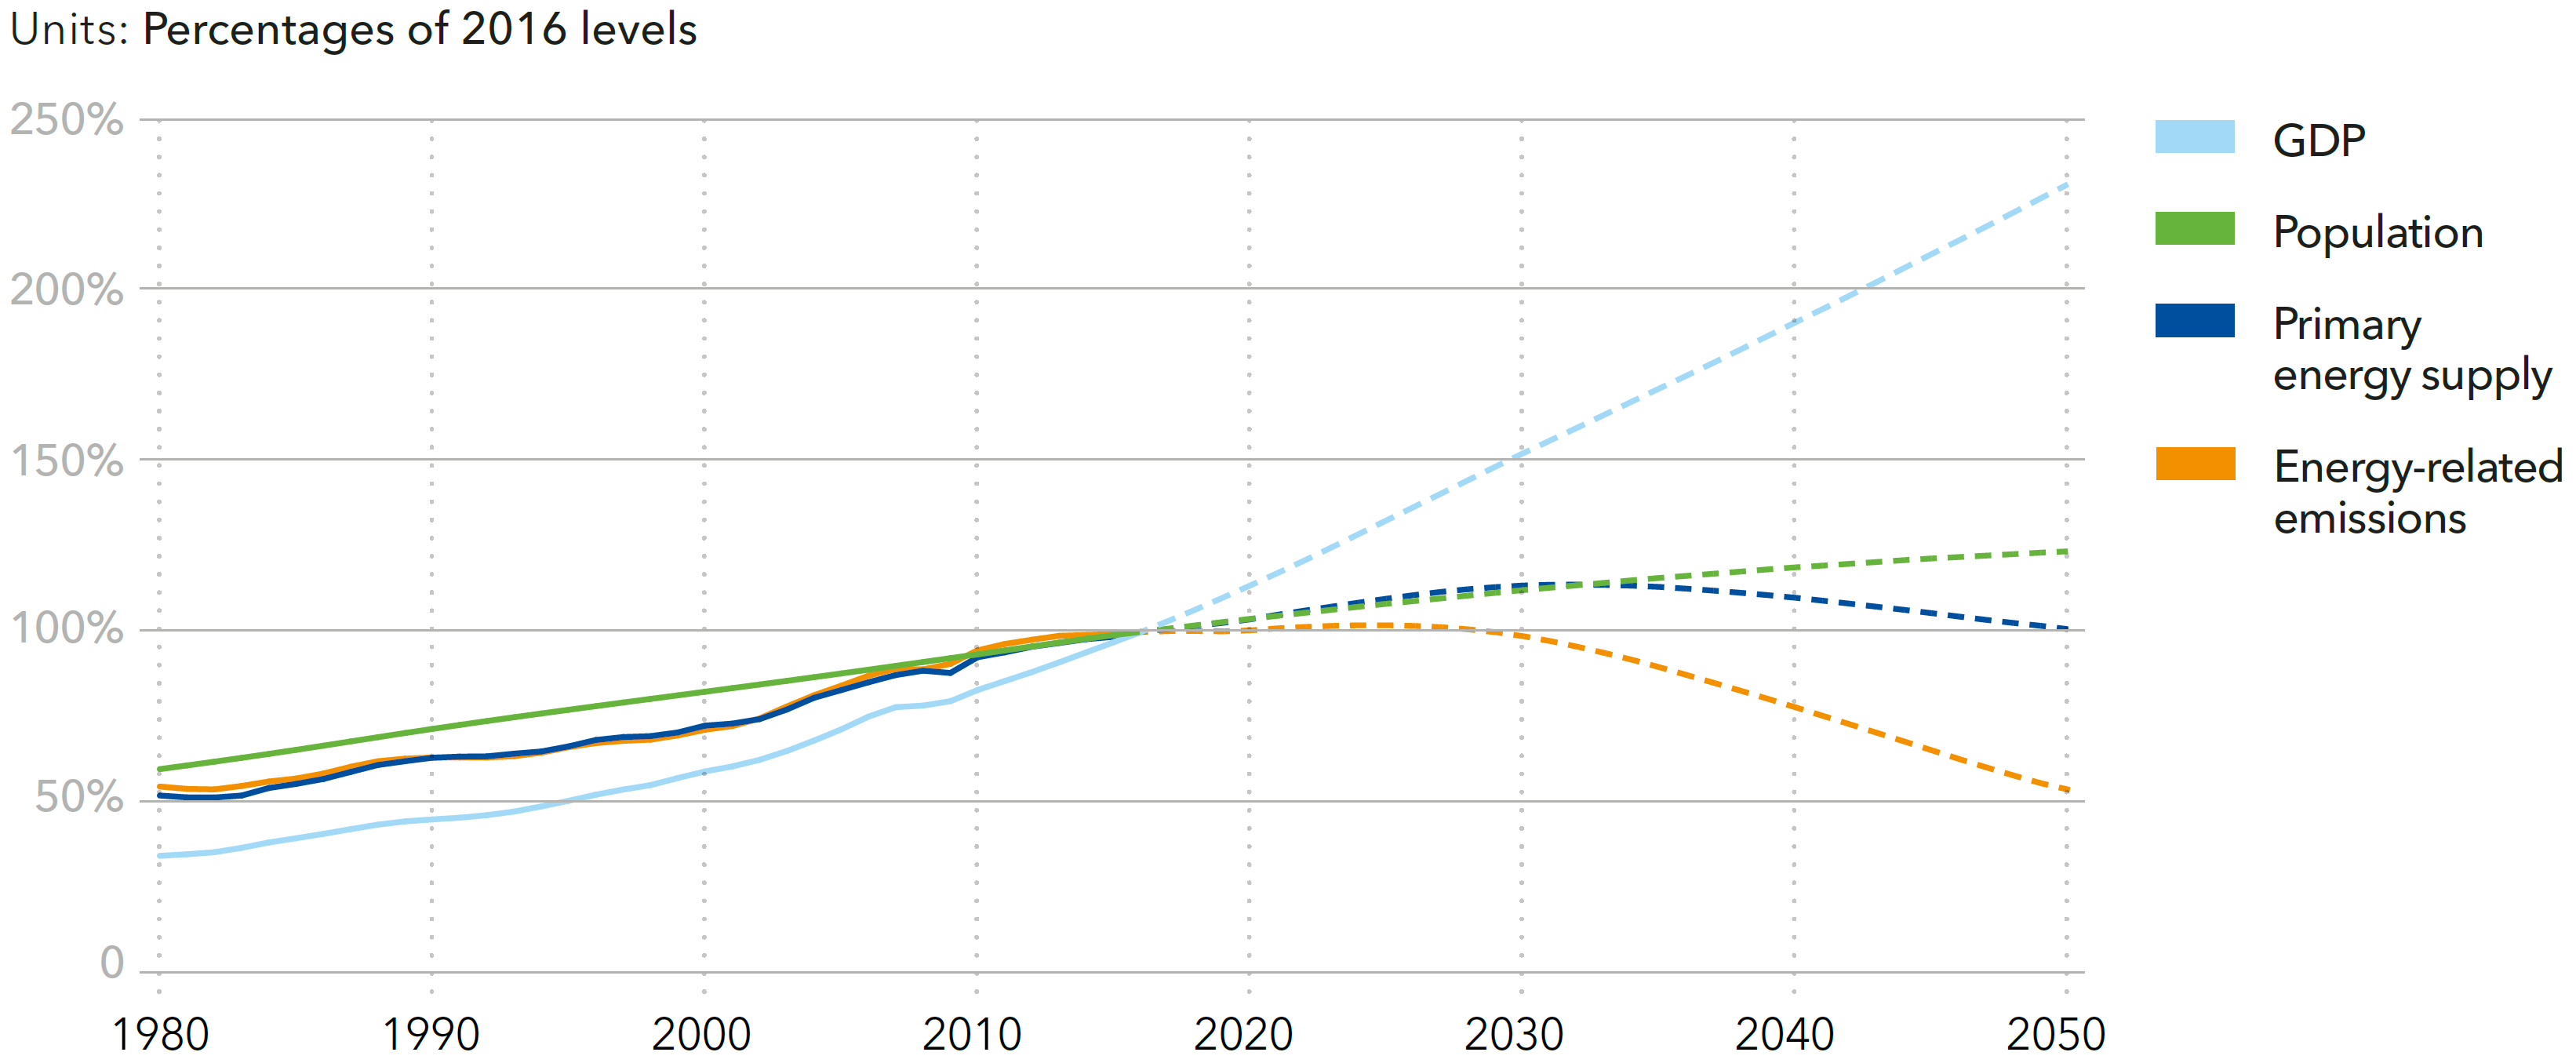
Source: DNV-GL (2018)13, Fig. 7.4
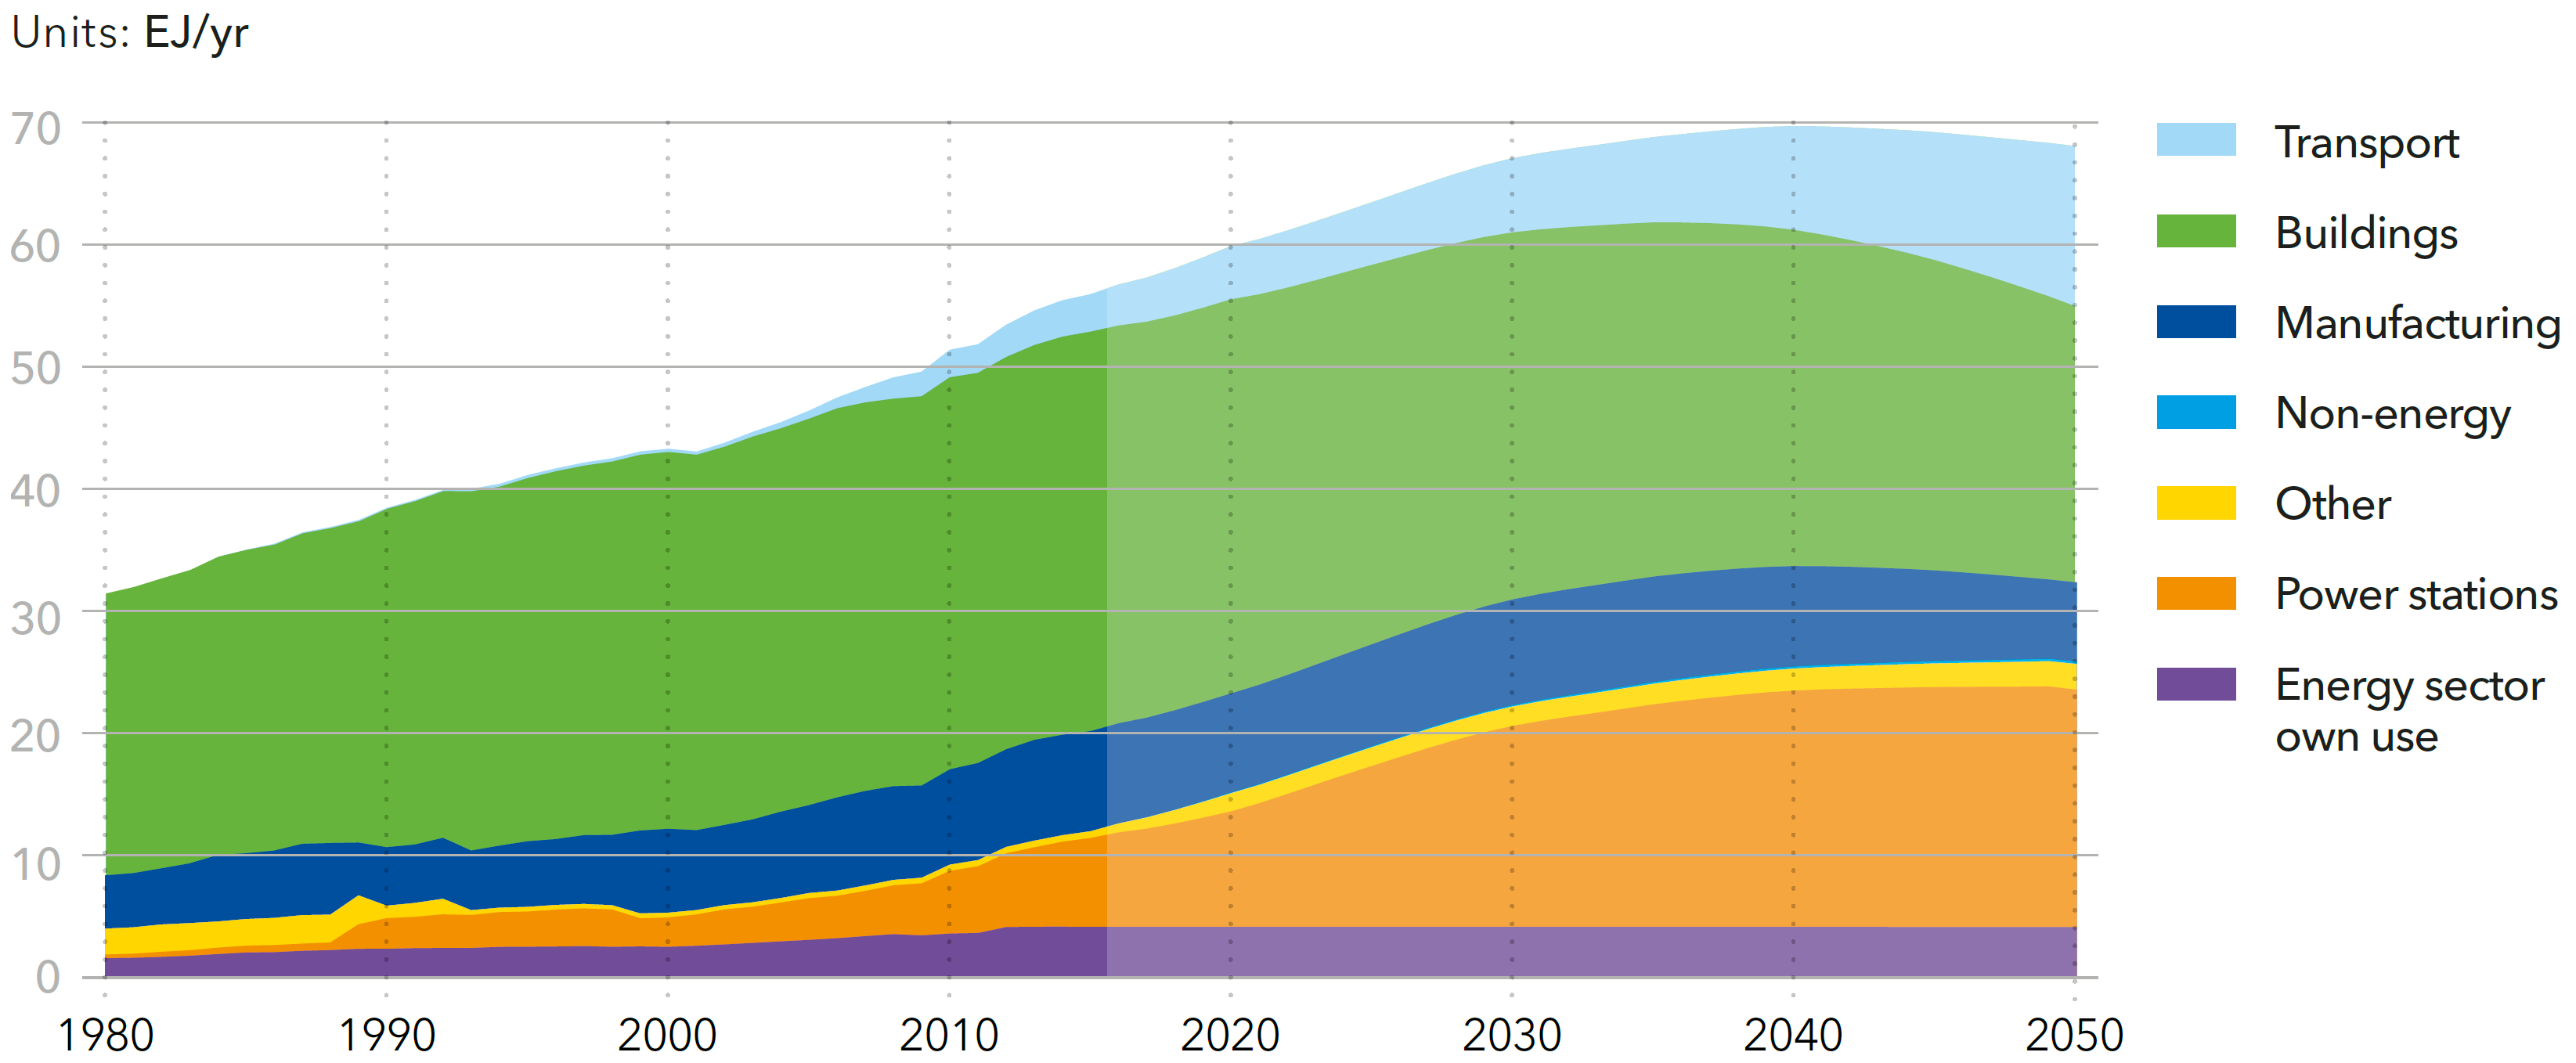
Energy Transition Outlook 2018 – DNV-GL Base forecasts 2018
![]()
Source: DNV-GL (2018)13, Table 4.9.2
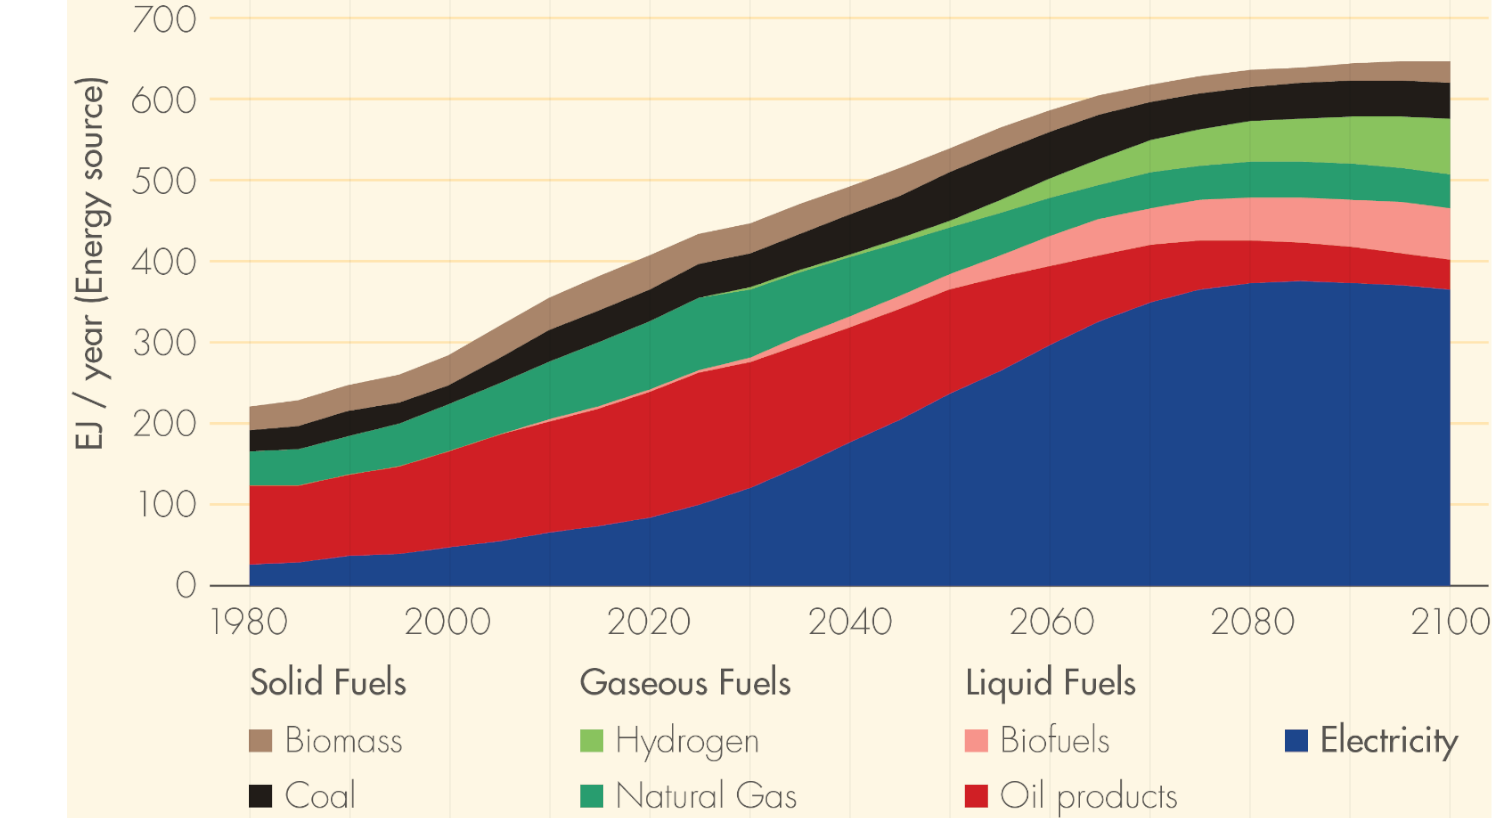
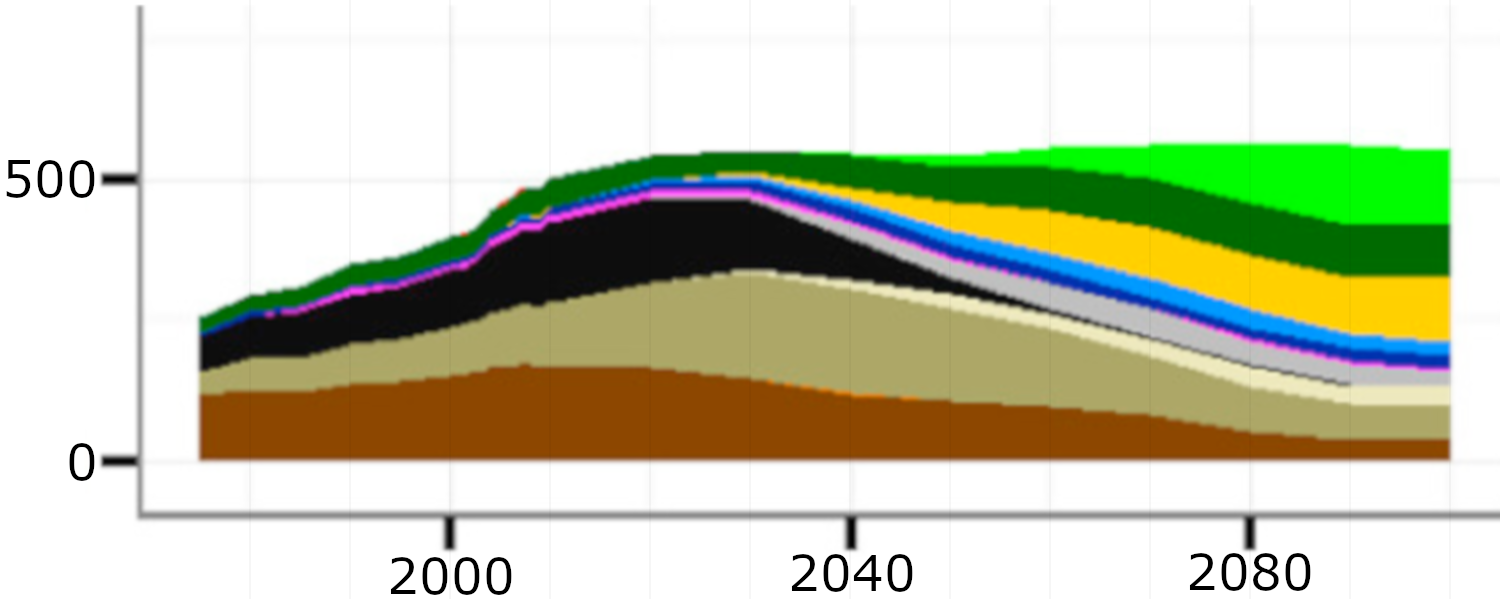
World primary energy supply by source (EJ/yr)
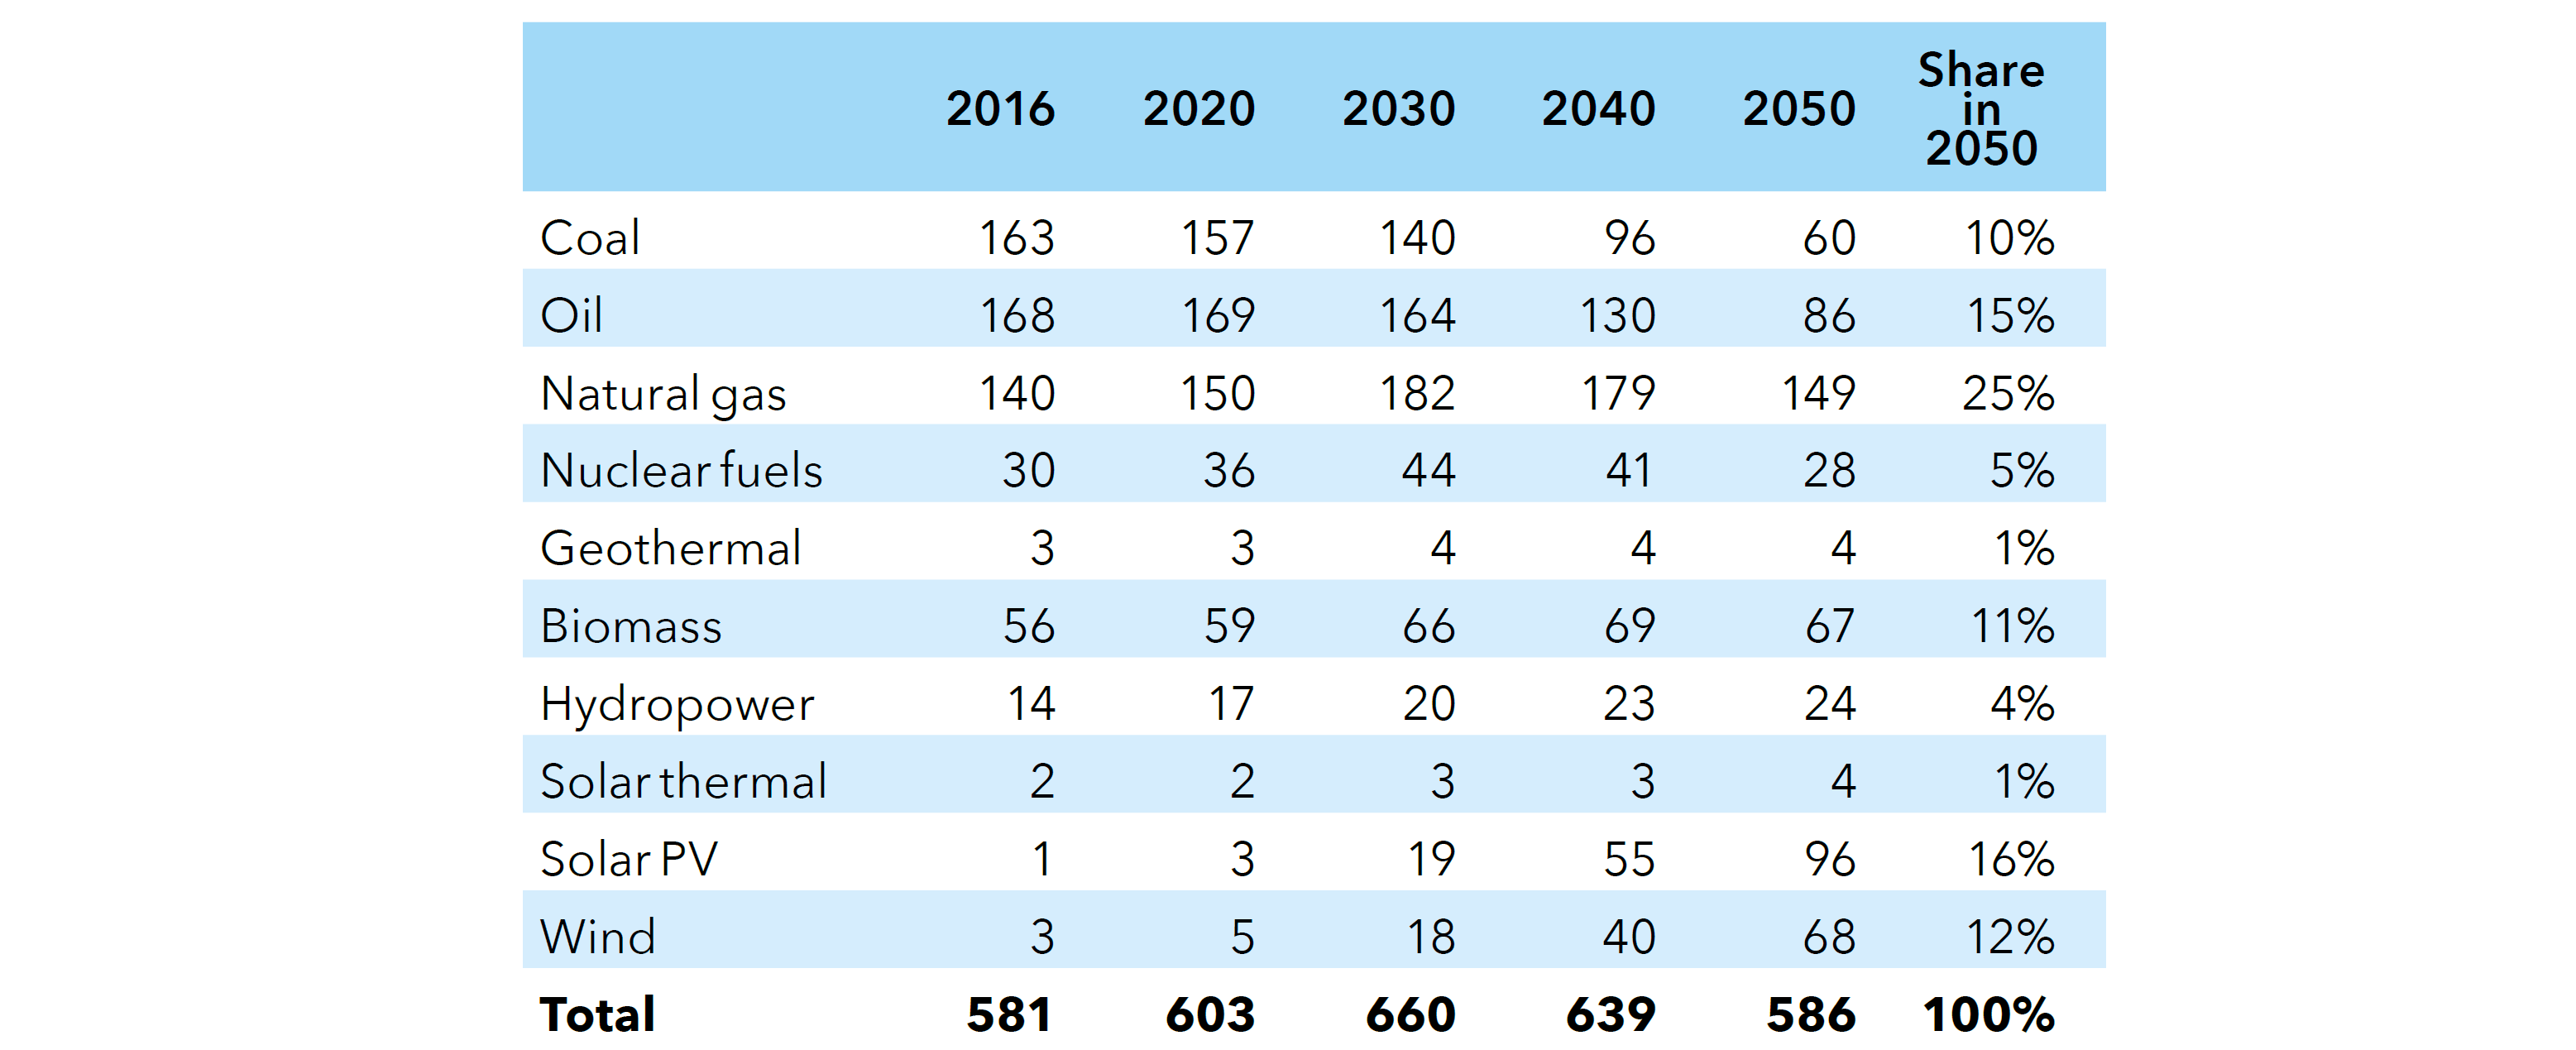
Source: DNV-GL (2018)13, Table 4.3.1
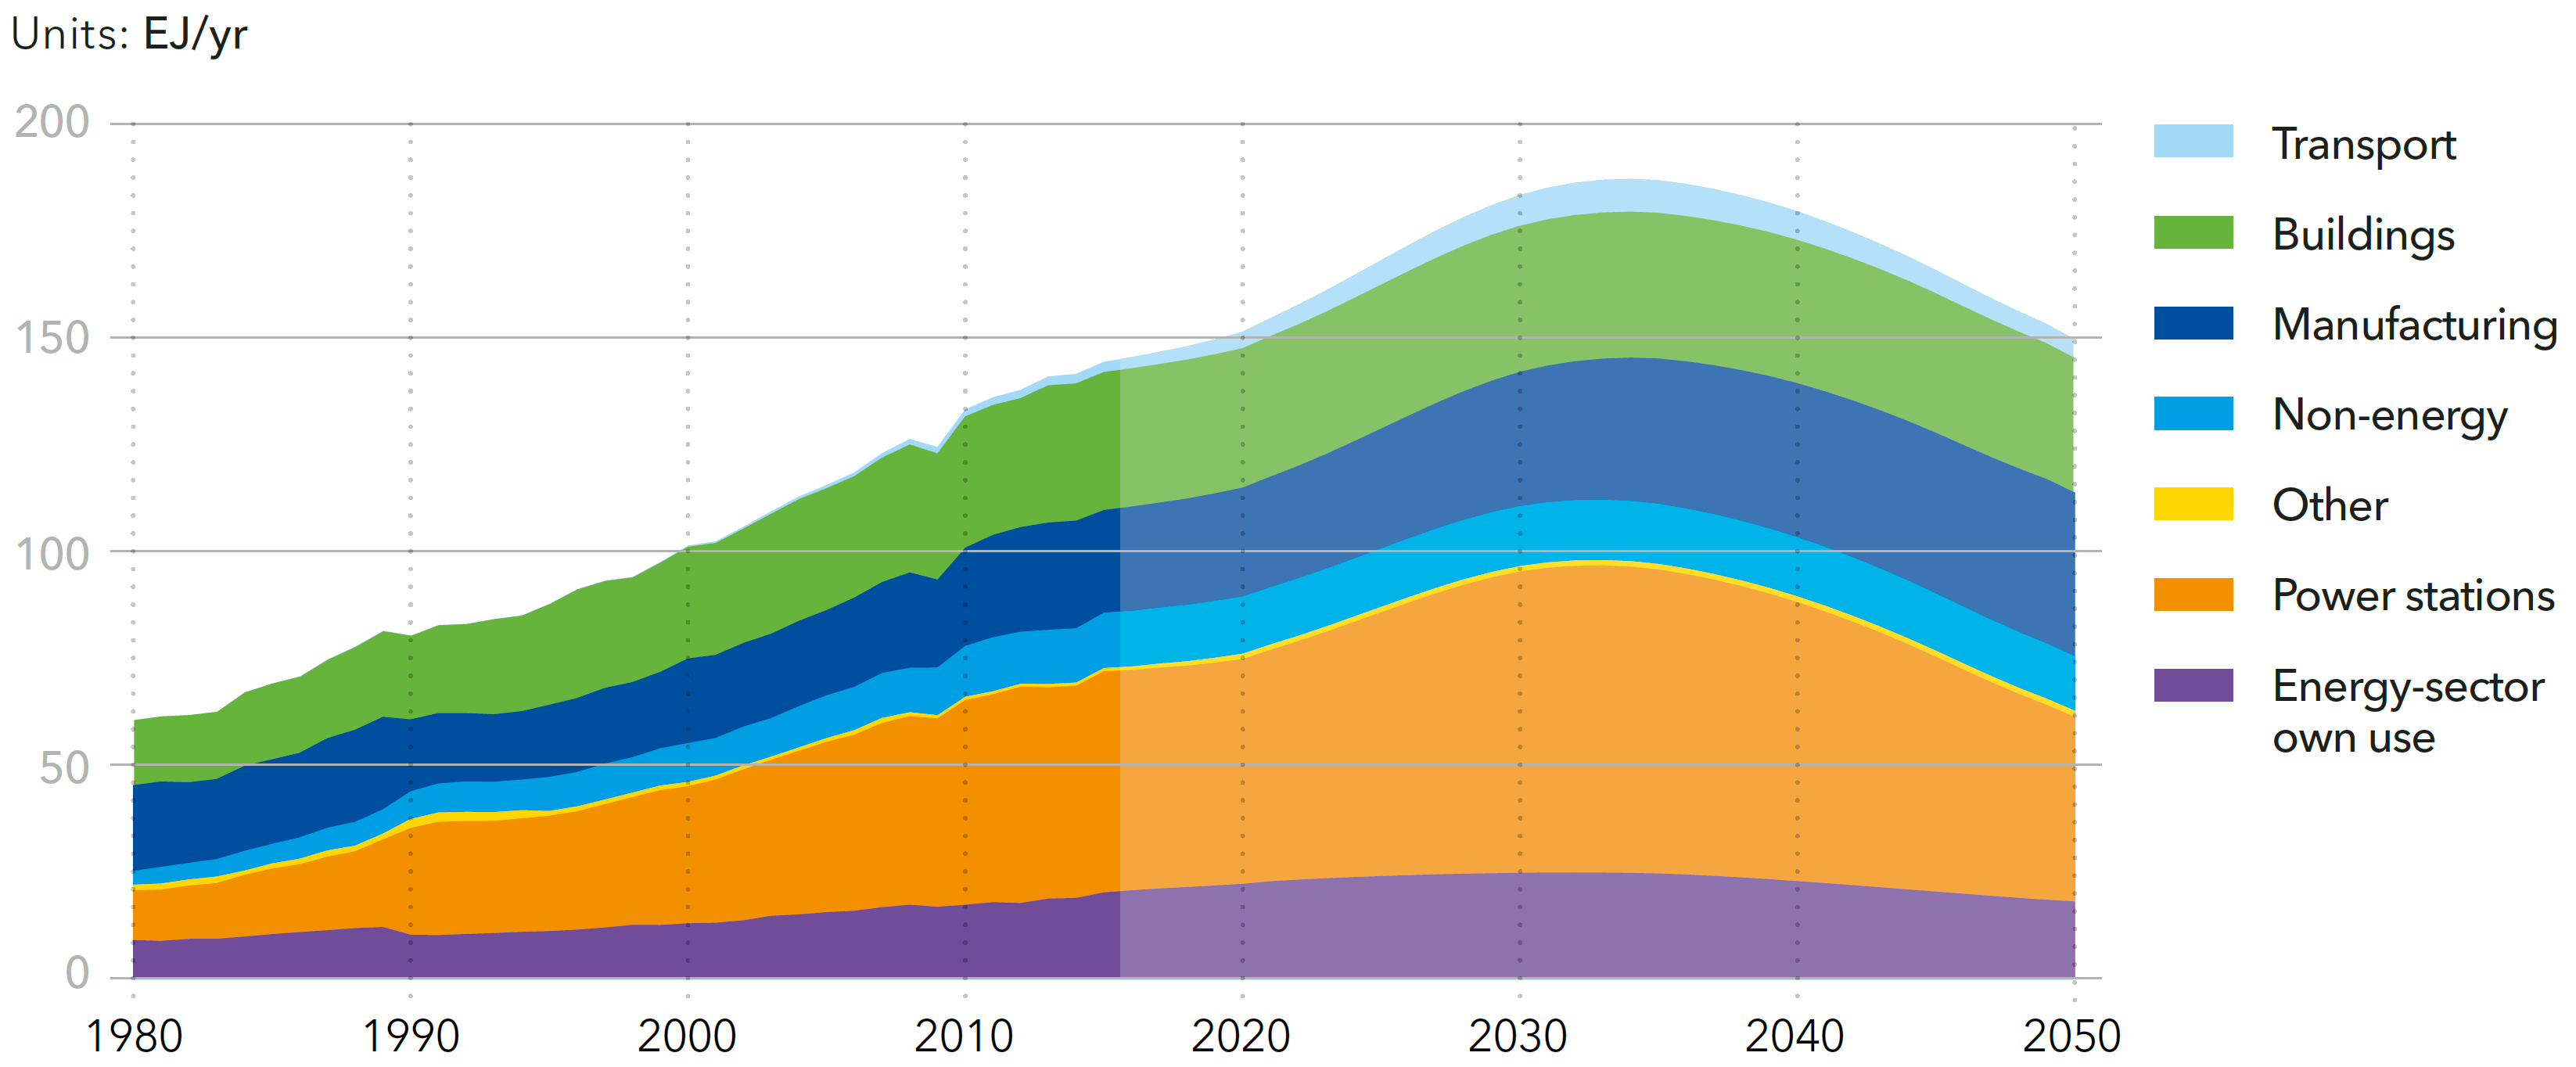
World primary energy supply by source
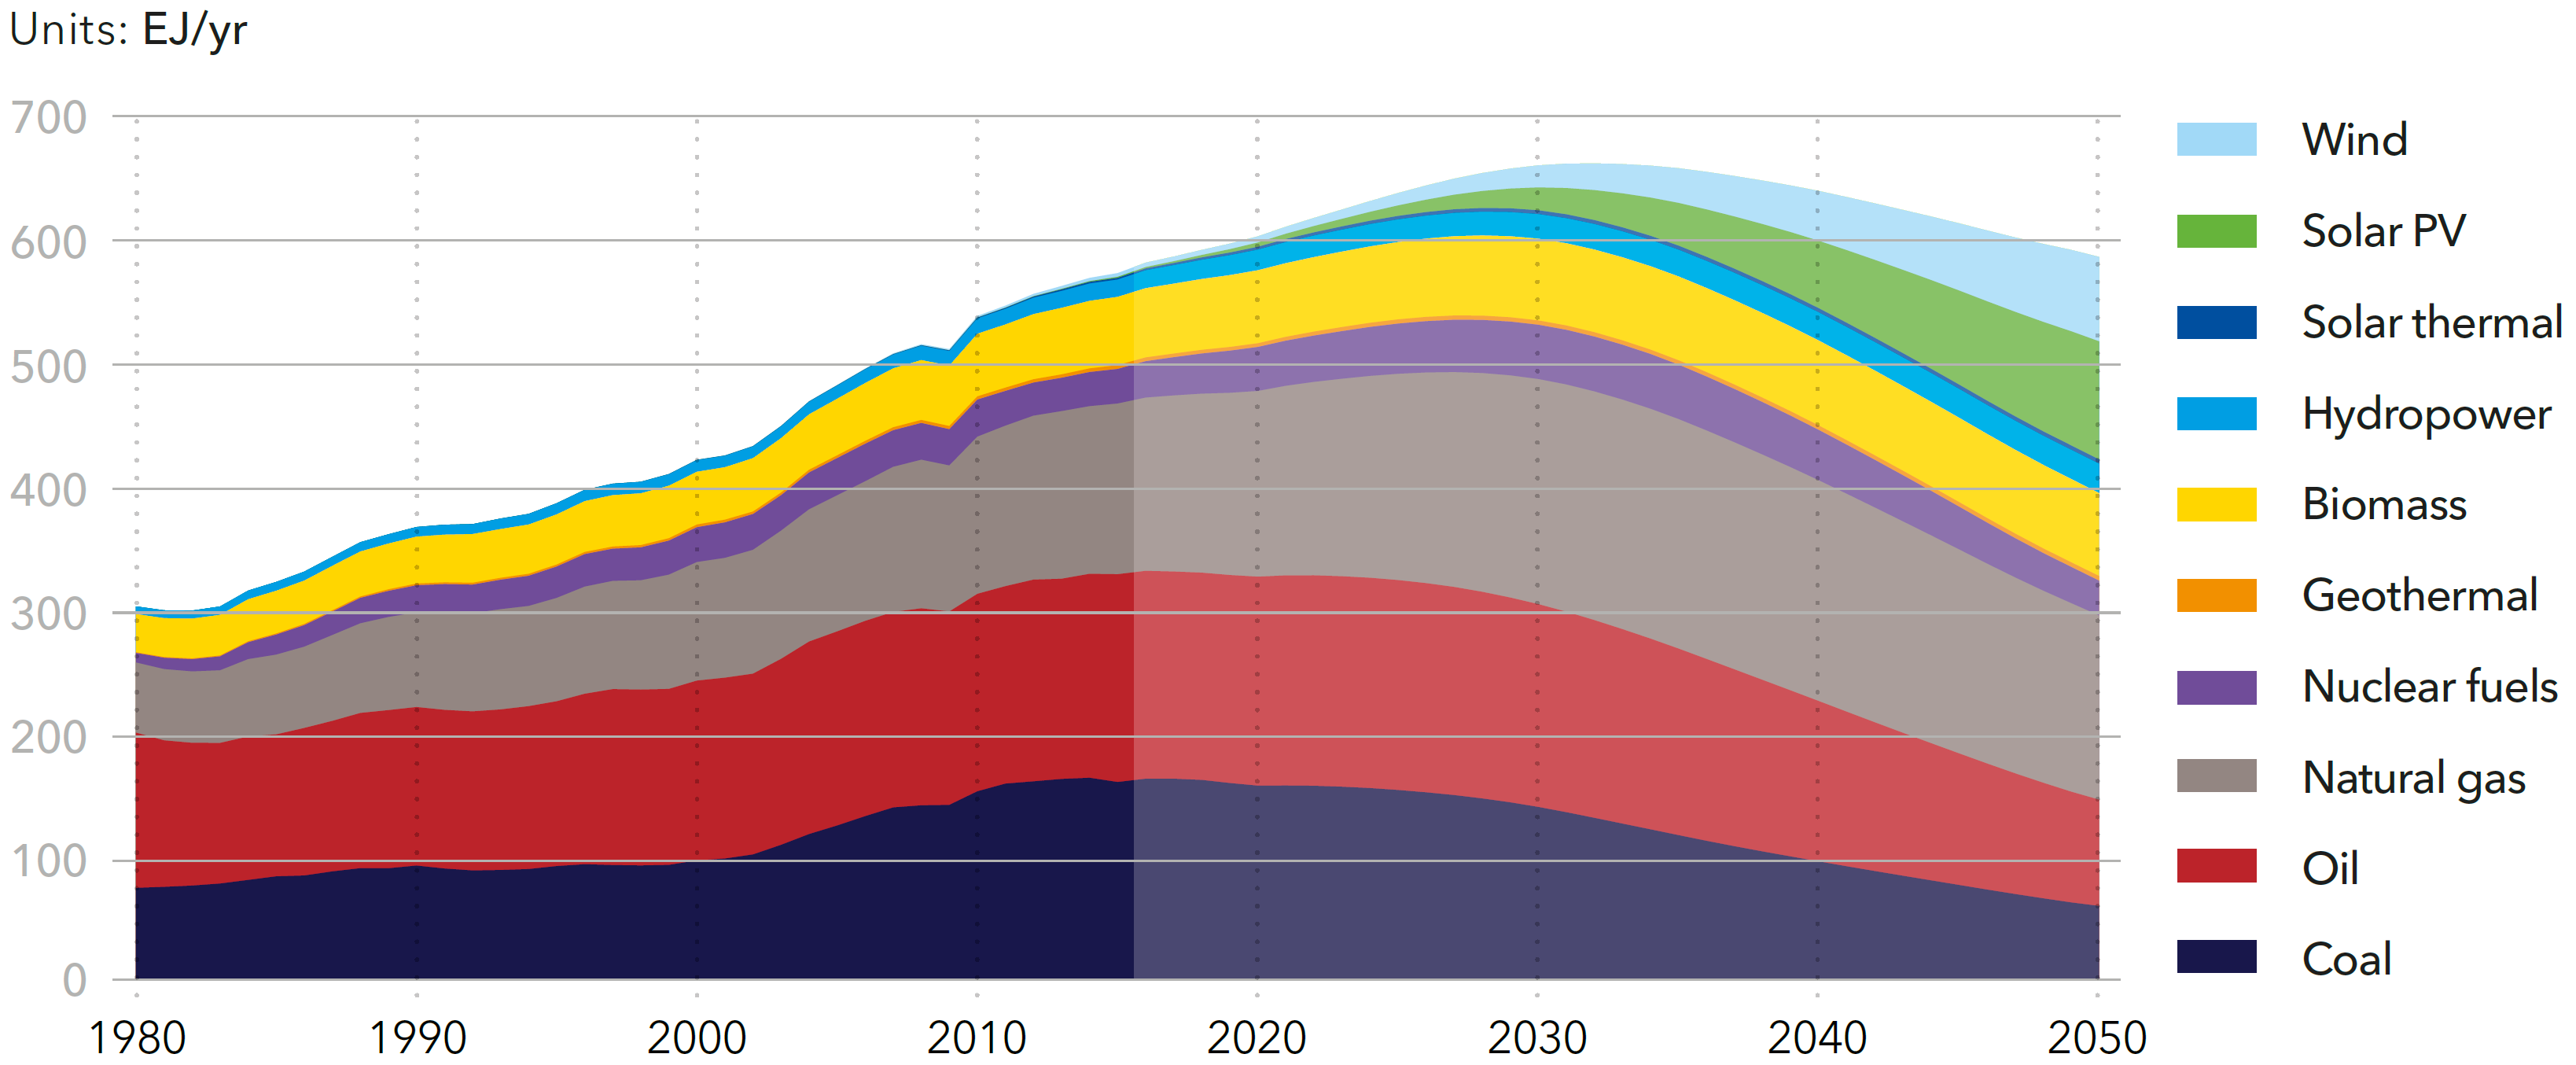
Source: DNV-GL (2018)13, Fig. 4.3.1
World final energy demand by carrier
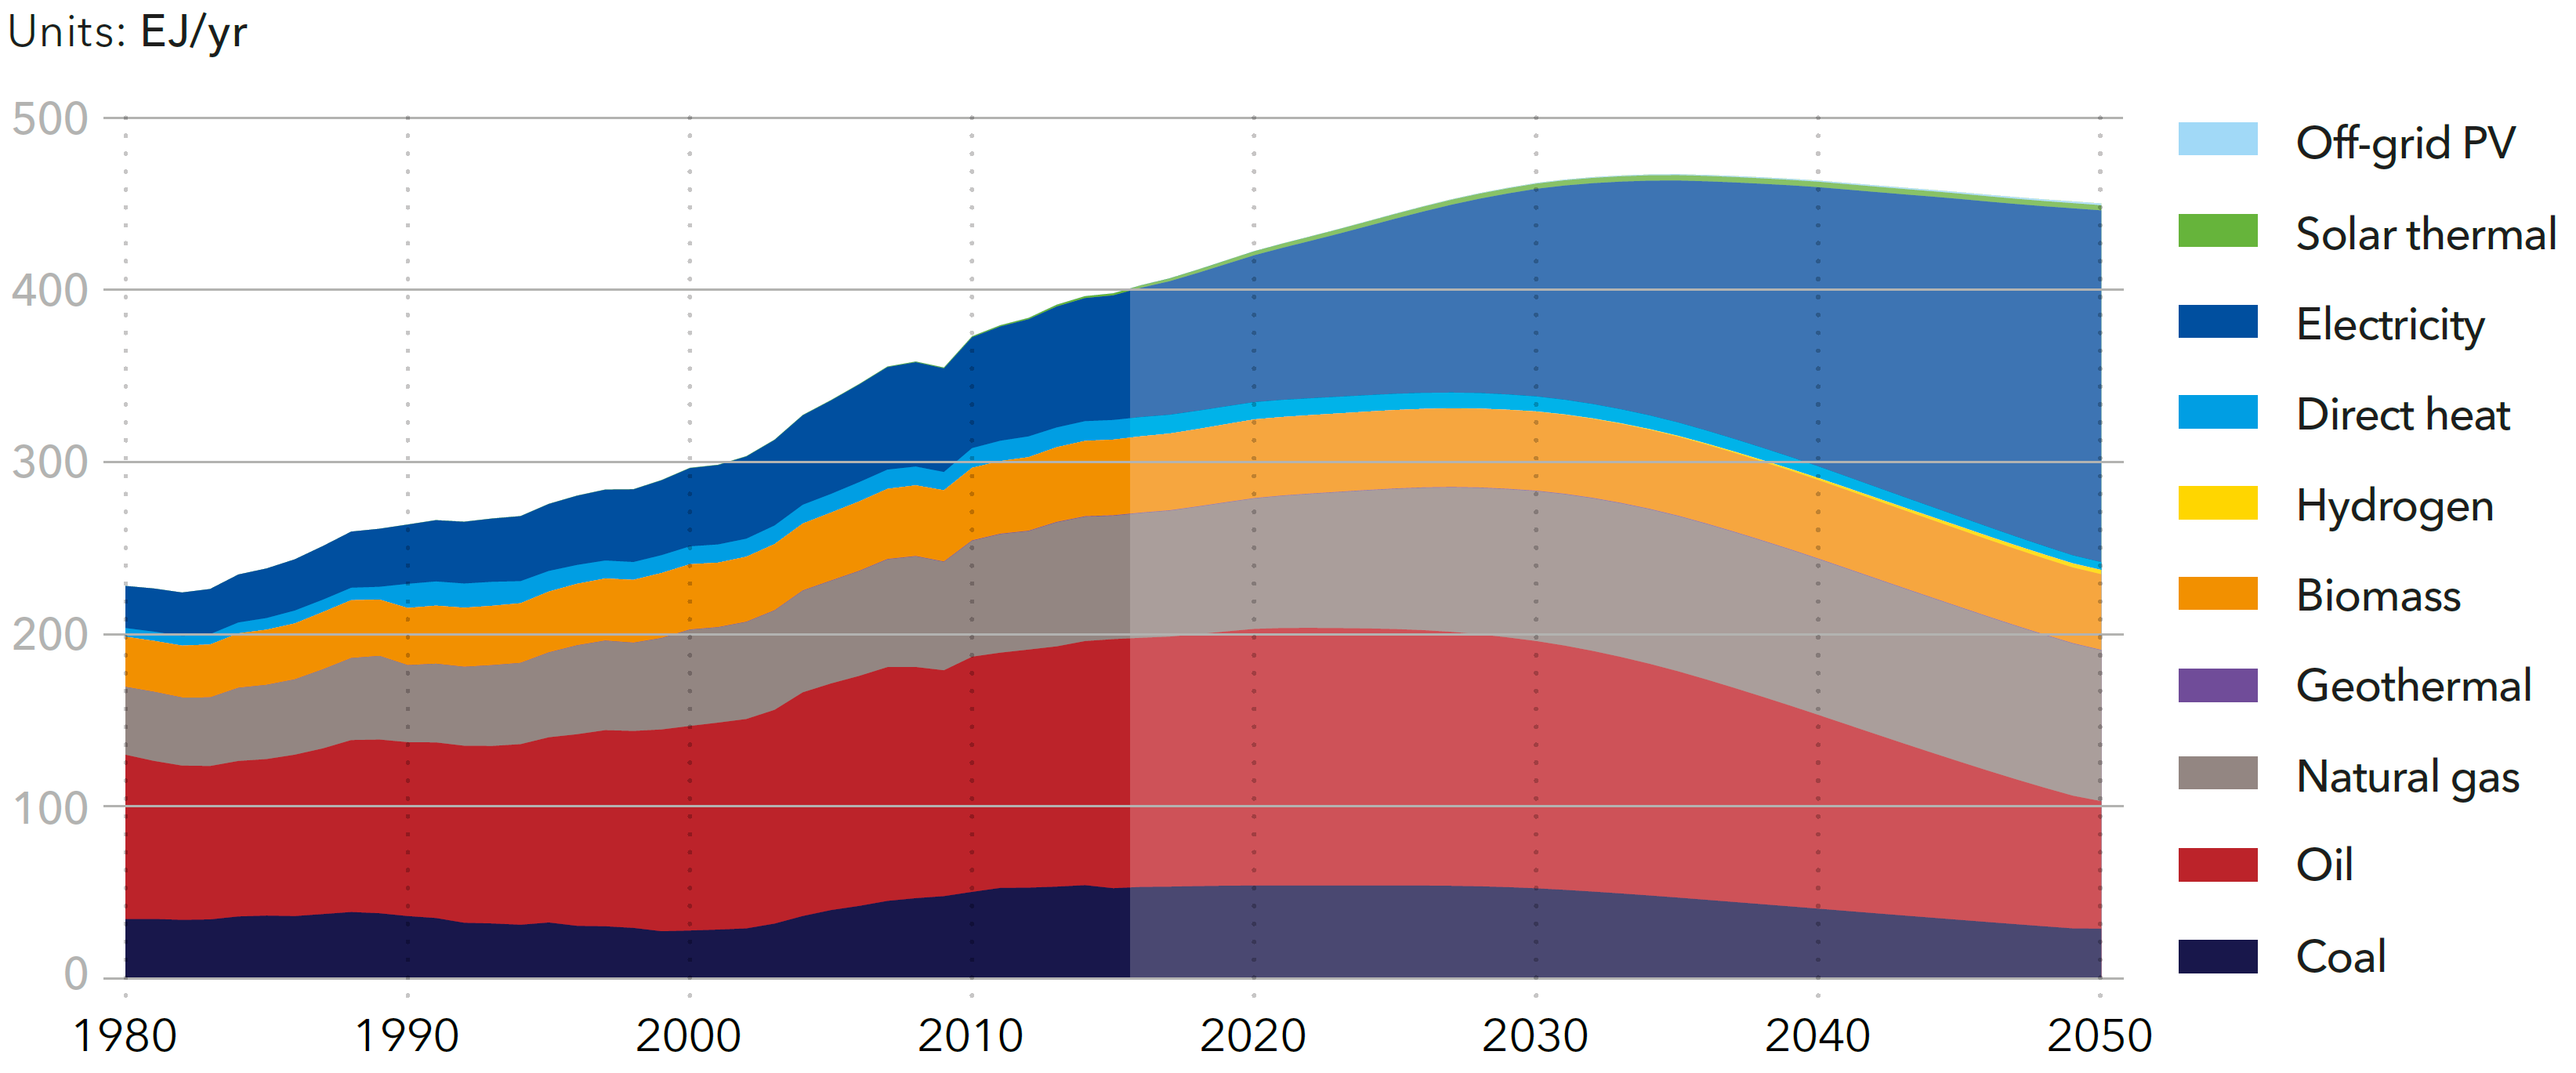
Source: DNV-GL (2018)13, Fig. 4.1.27
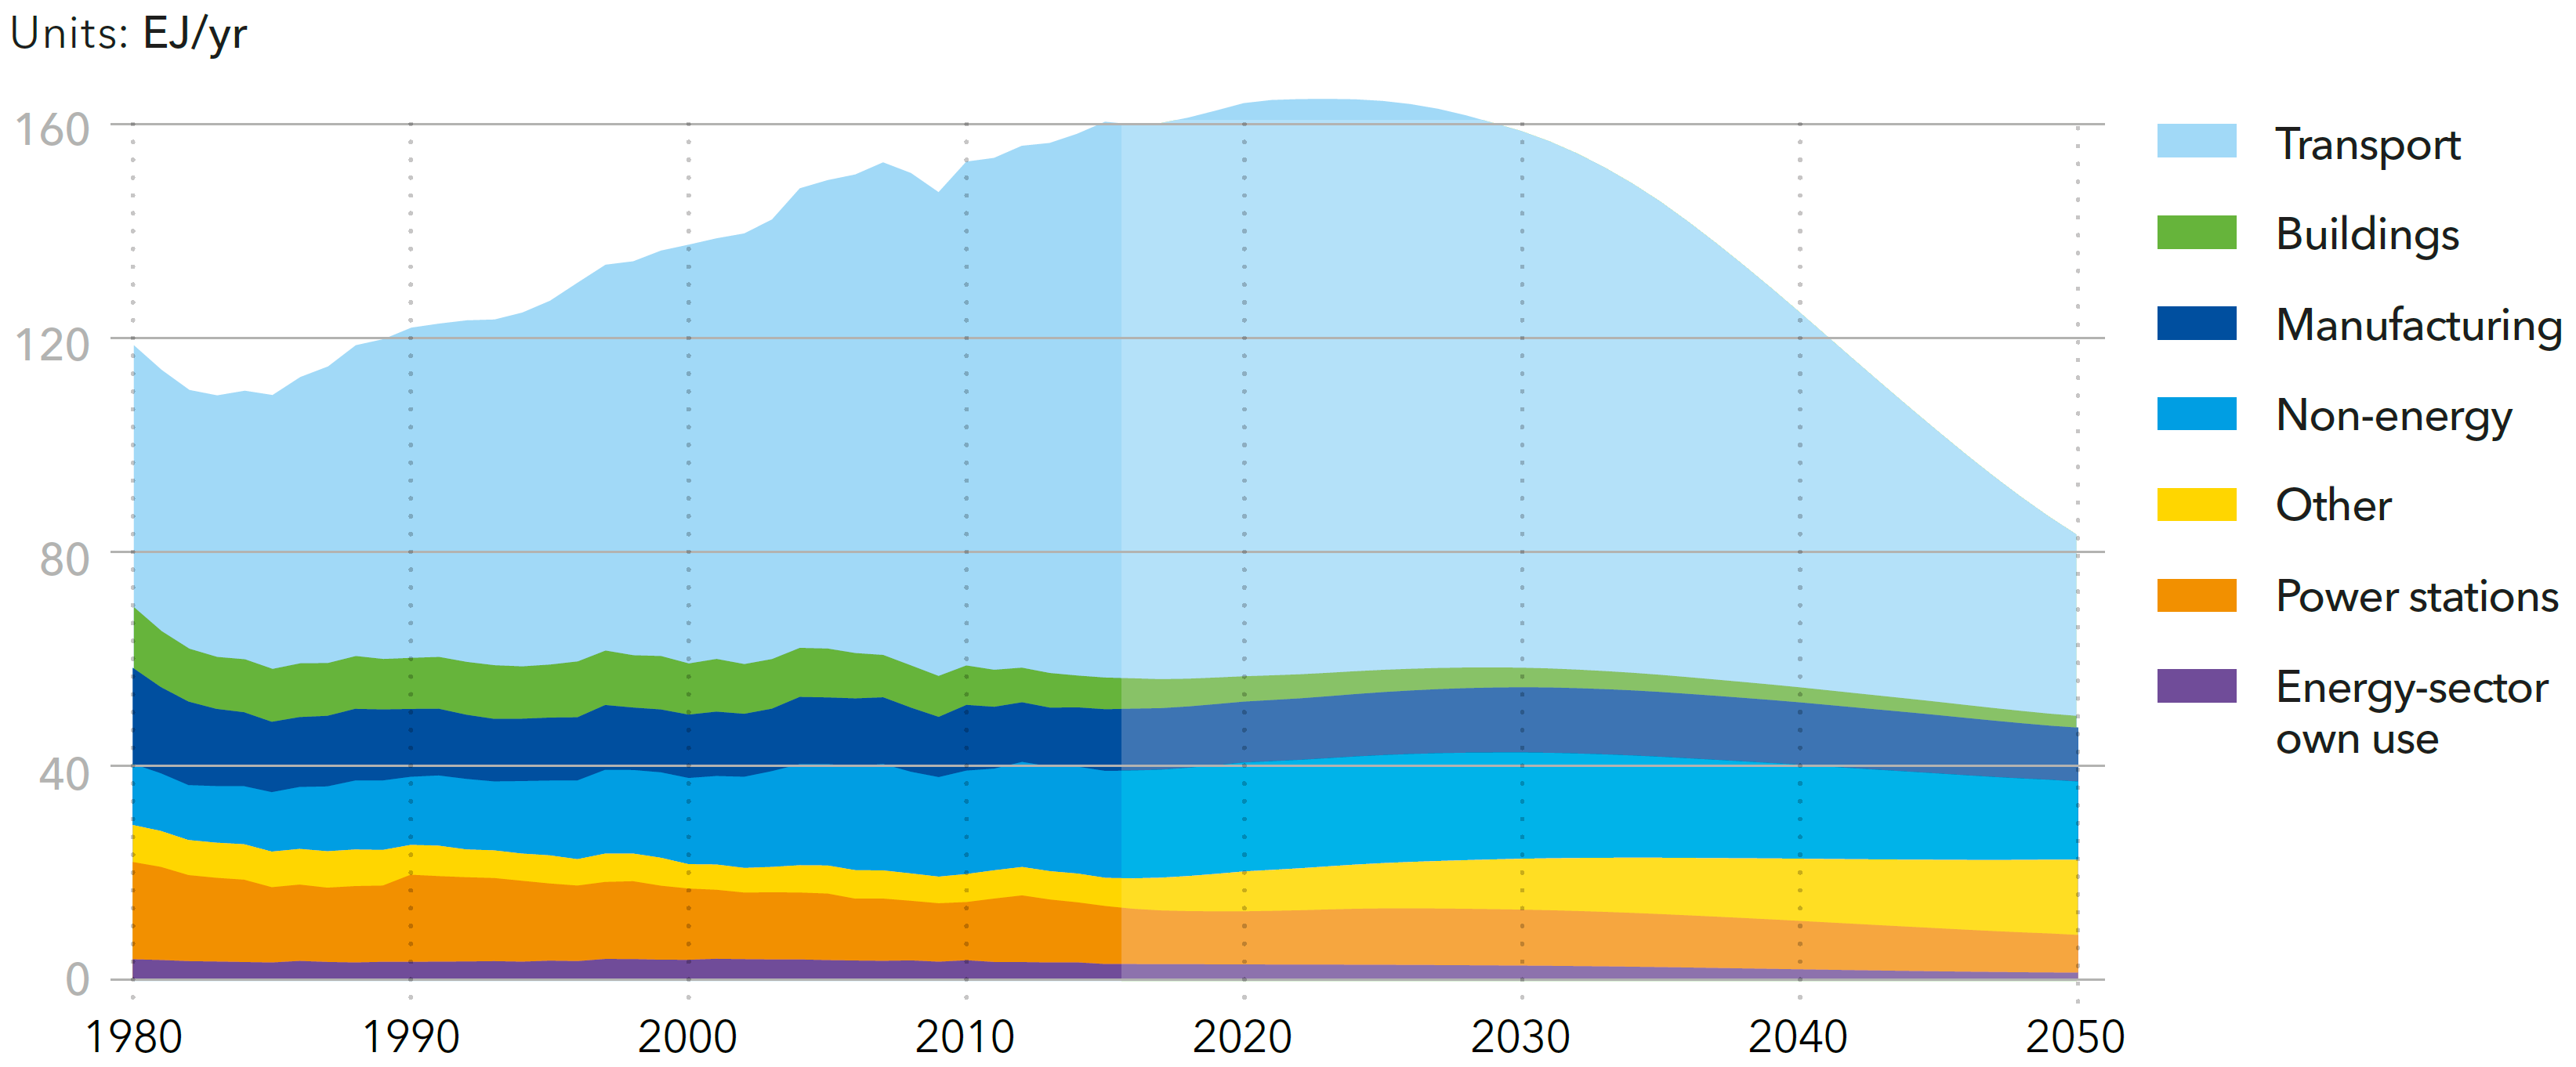
World final energy demand by sector
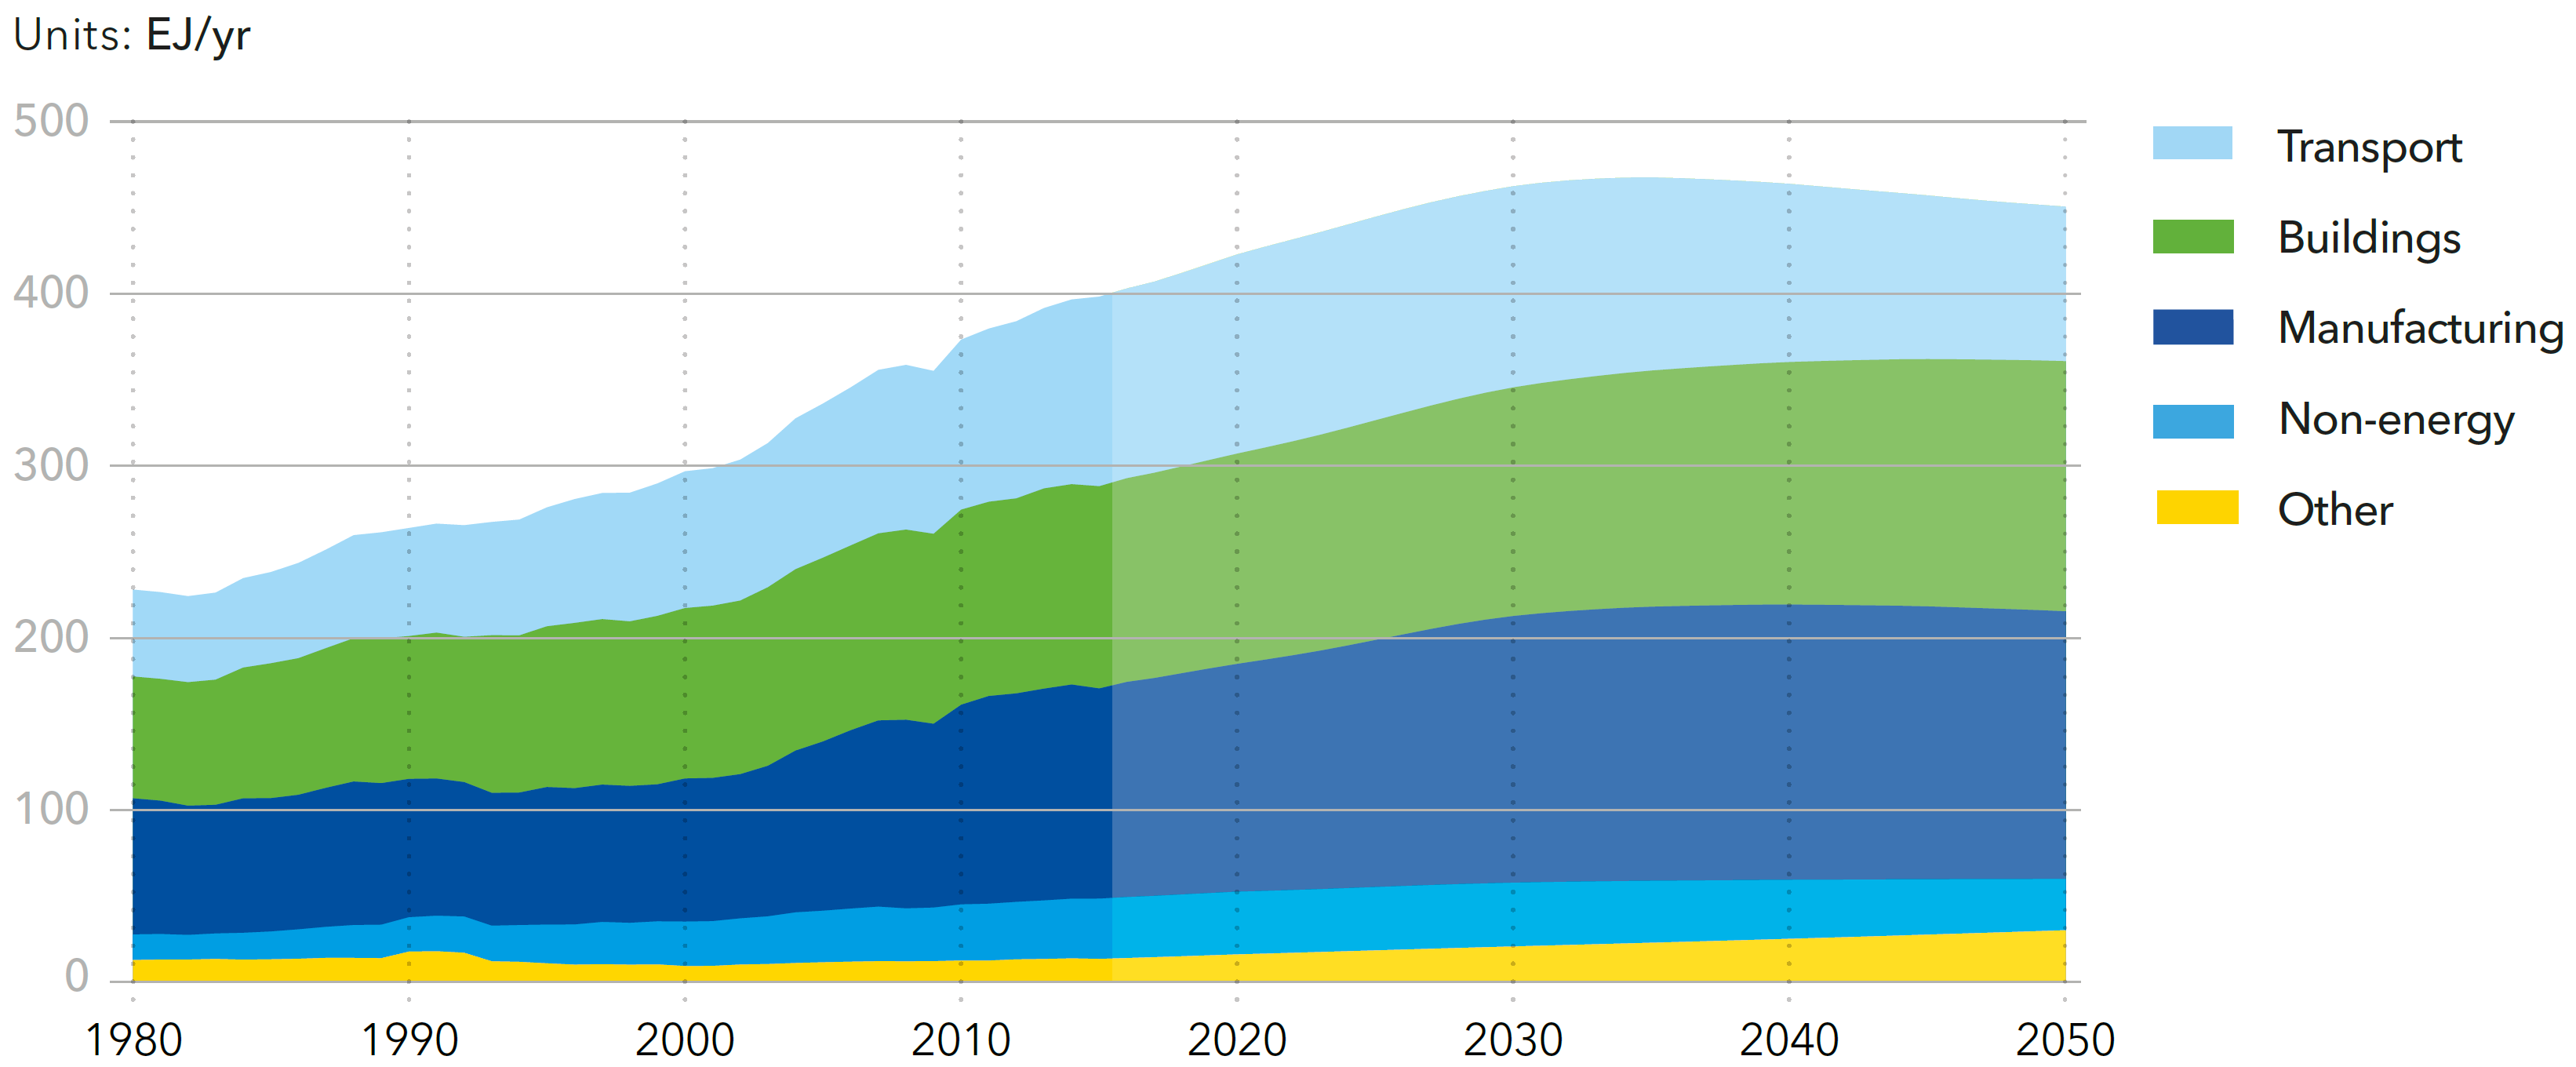
Source: DNV-GL (2018)13, Fig. 4.1.1
World electricity generation by power station type
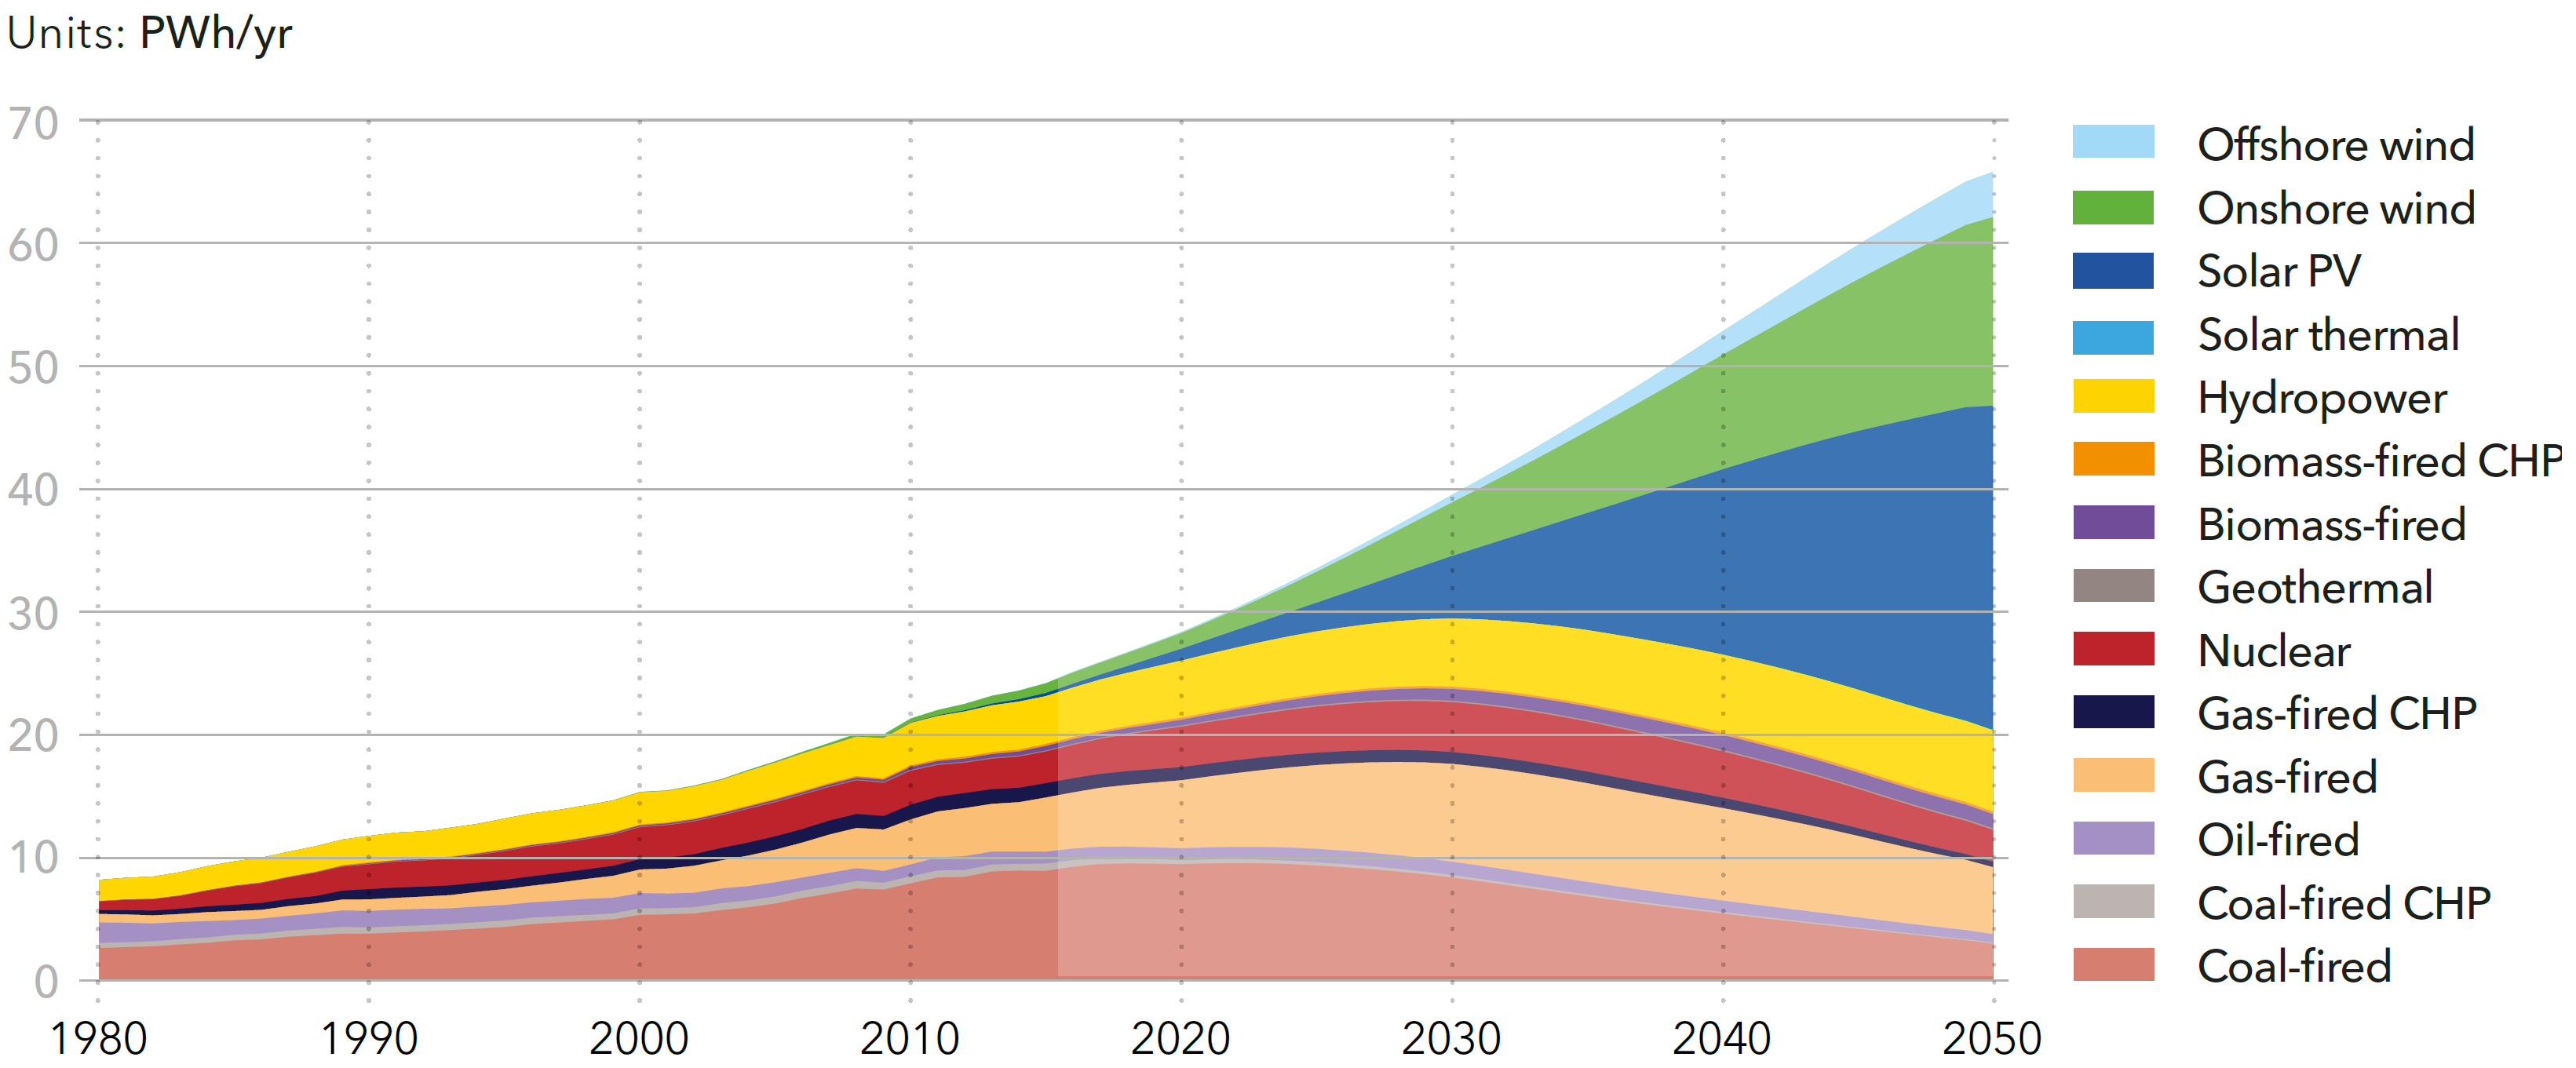
Source: DNV-GL (2018)13, Fig. 4.2.2
World electricity demand by sector
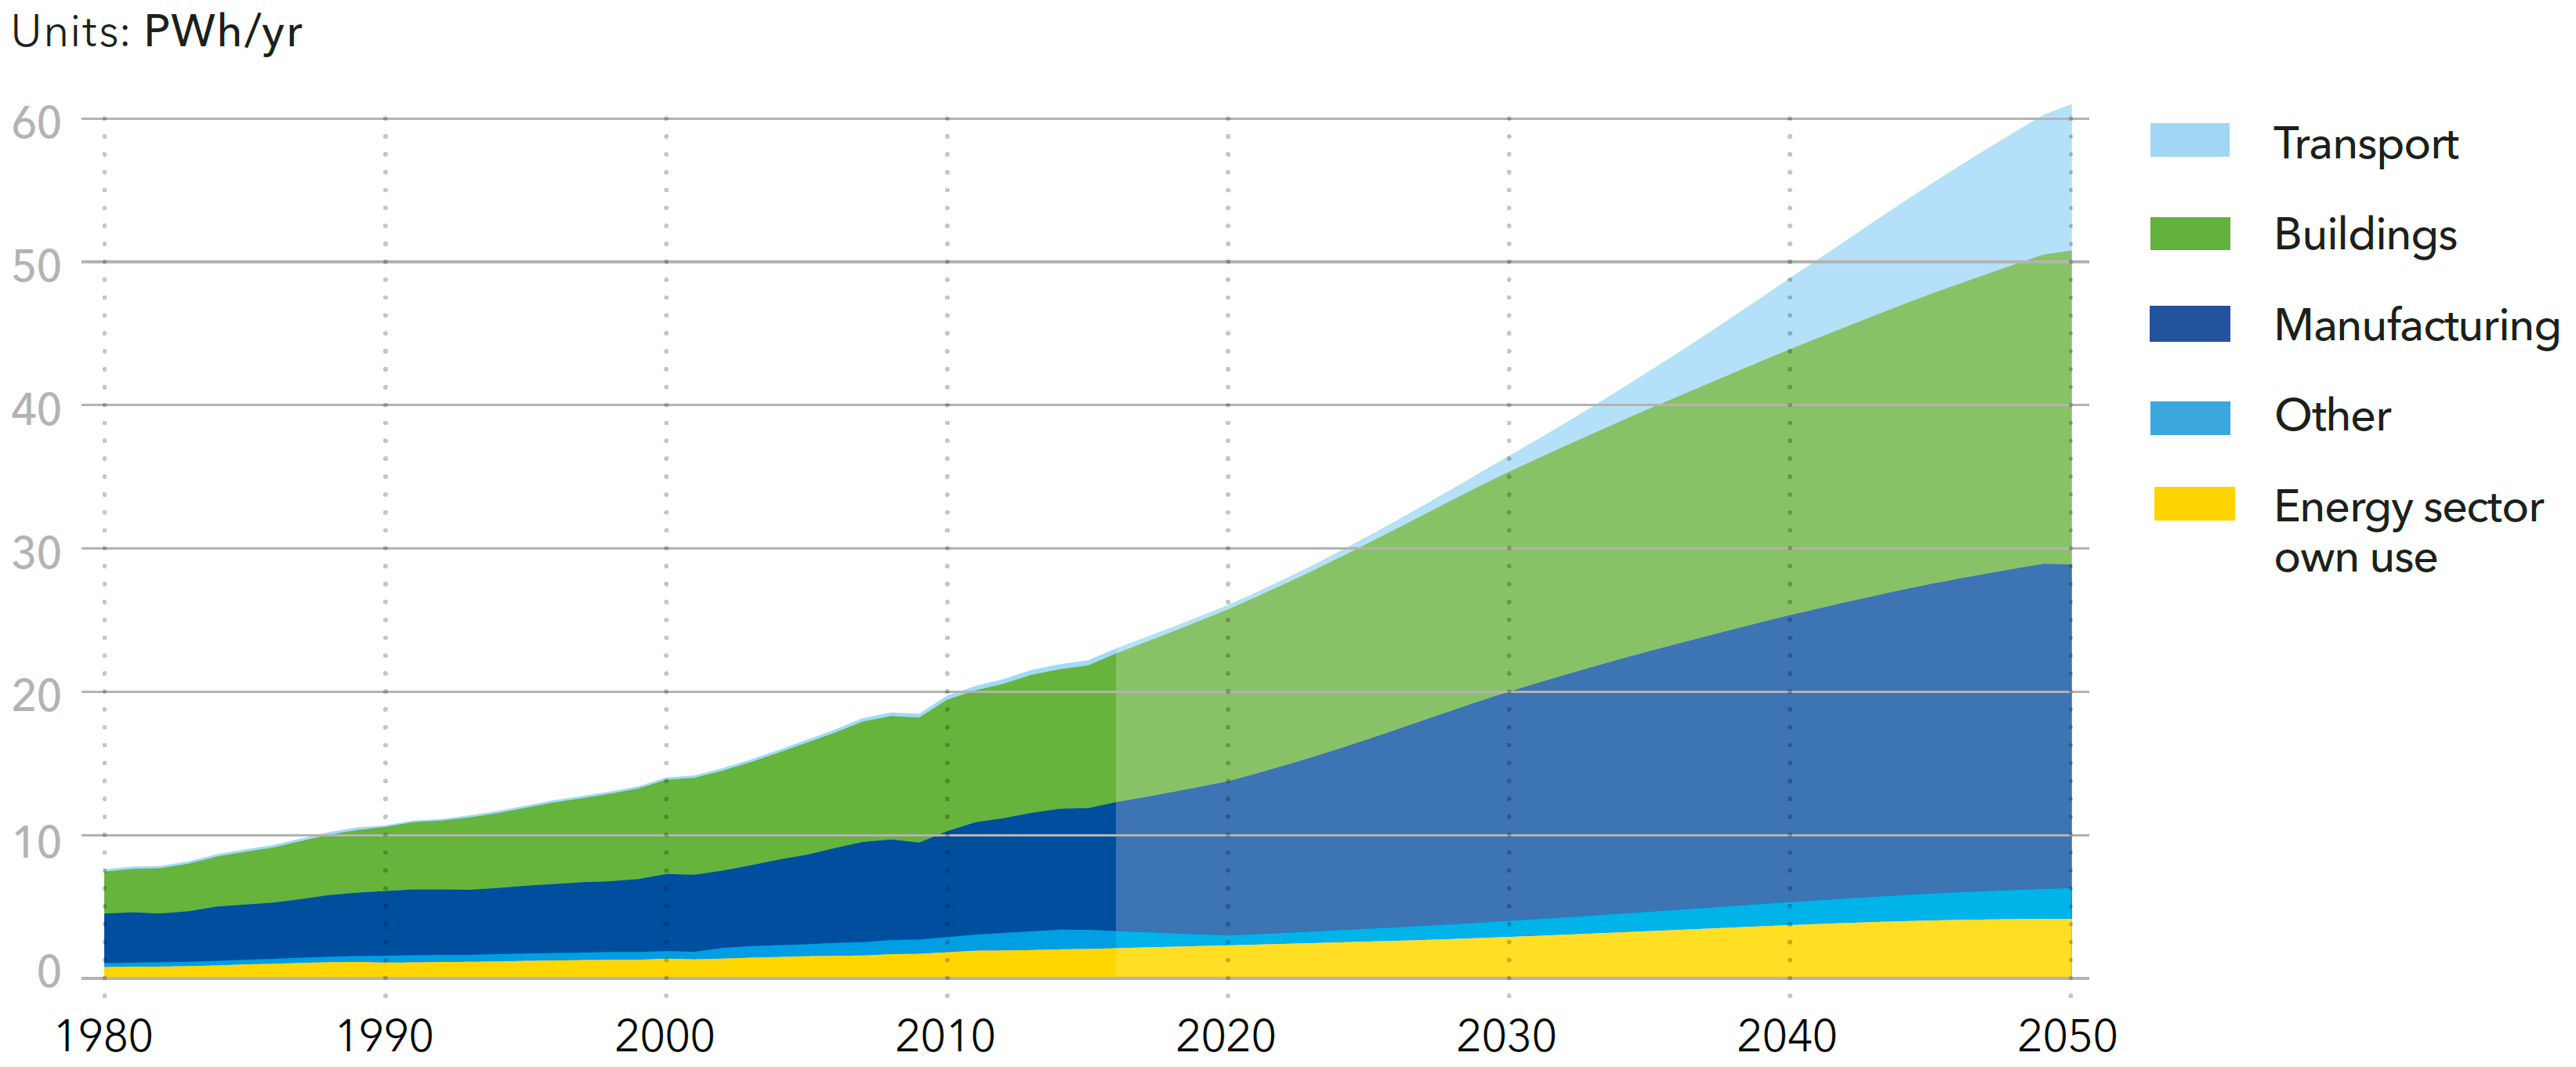
Source: DNV-GL (2018)13, Fig. 4.2.1
World installed electricity capacity in 2016 and 2050
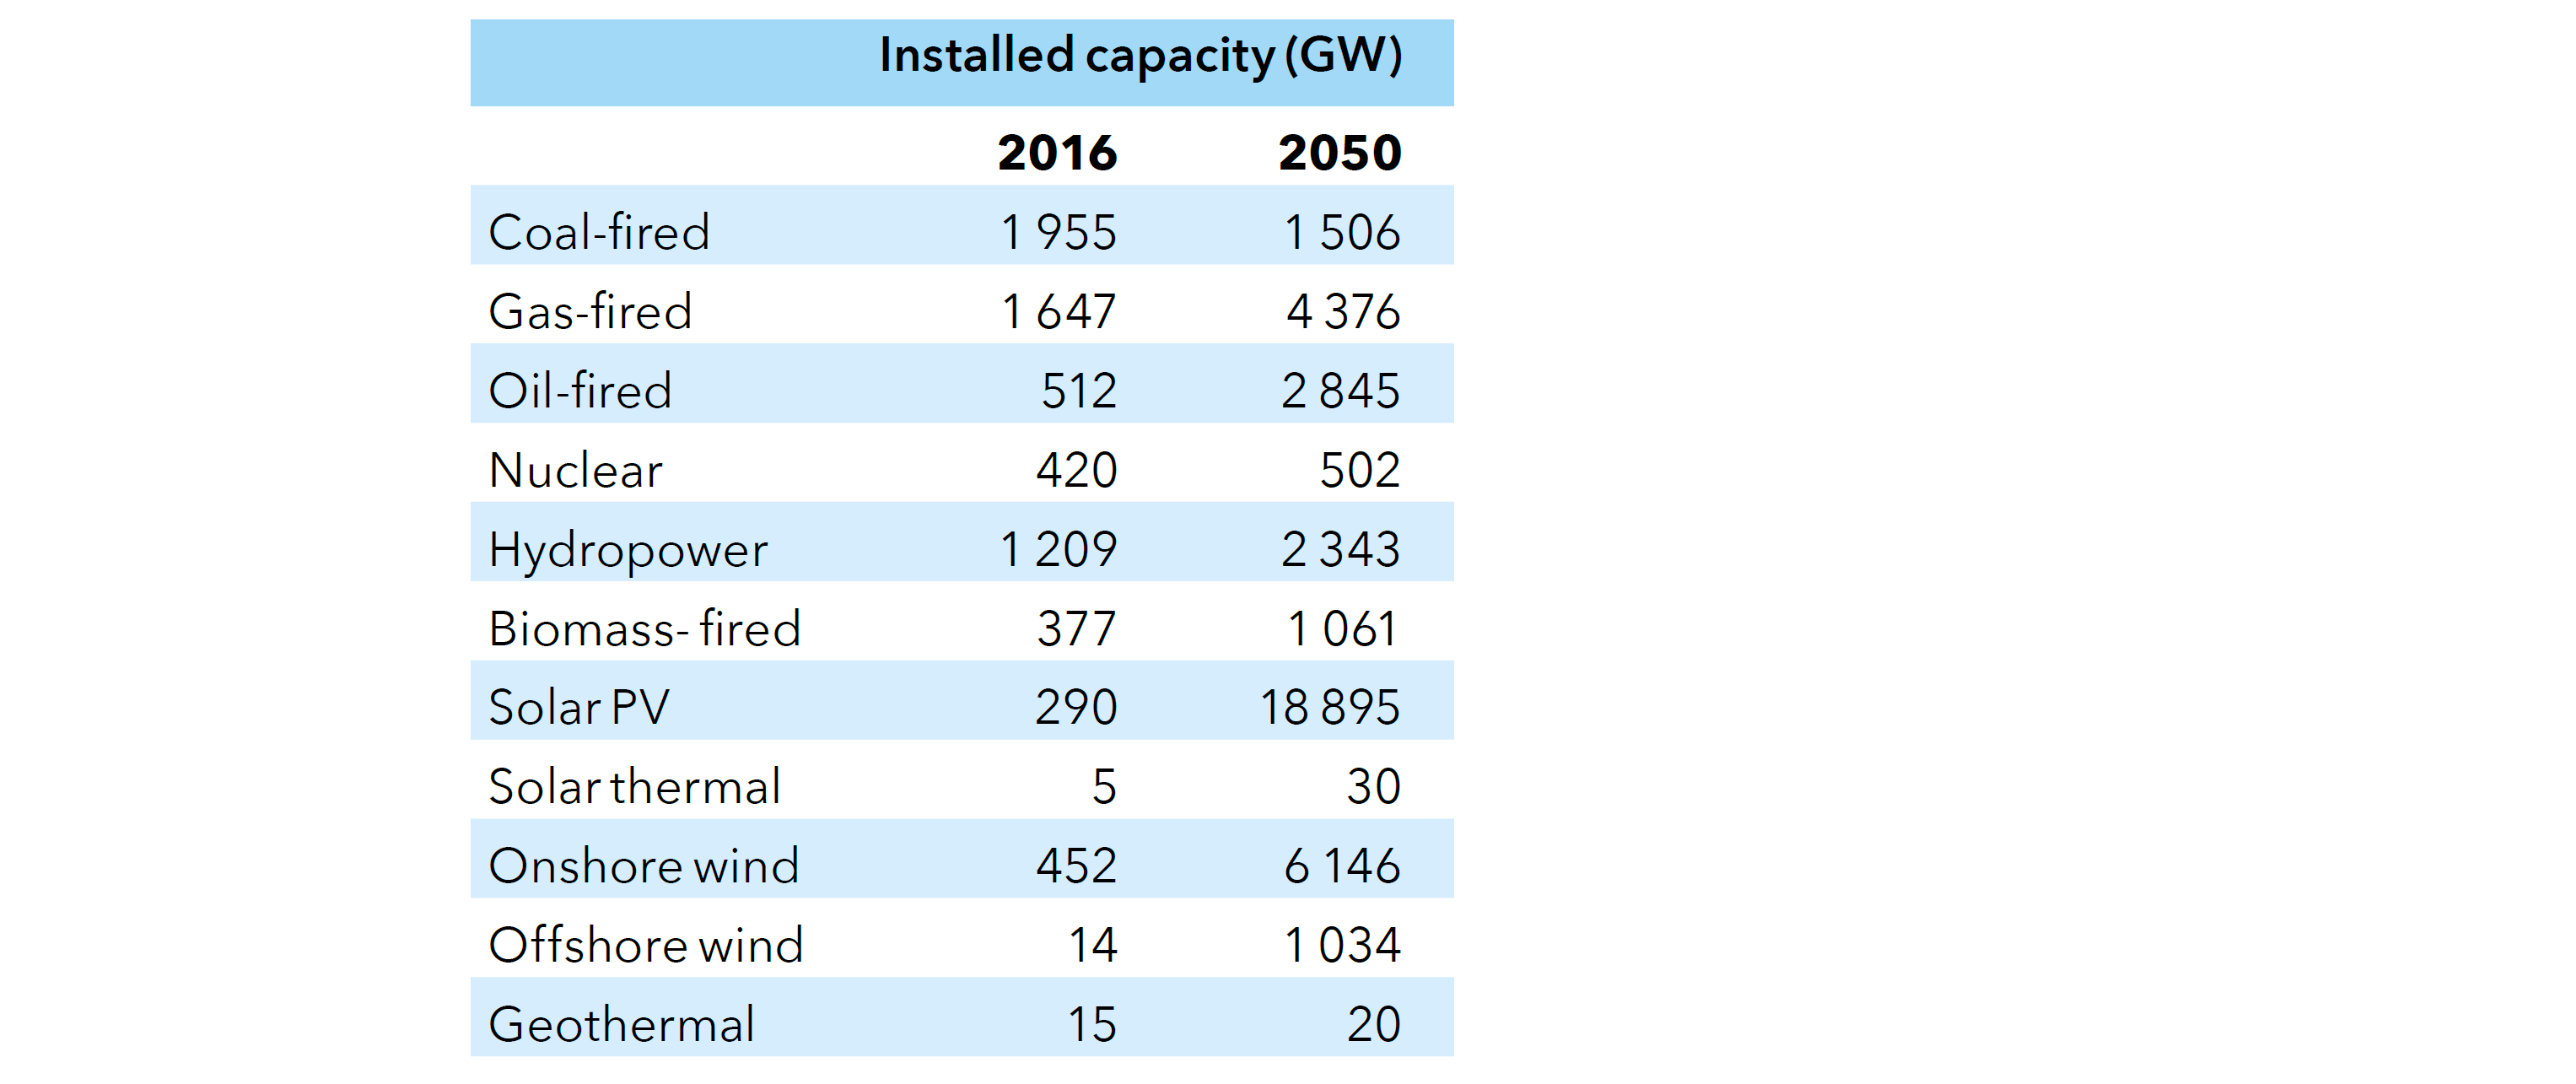
Source: DNV-GL (2018)13, Fig. Table 4.2.1
World electricity capacity additions
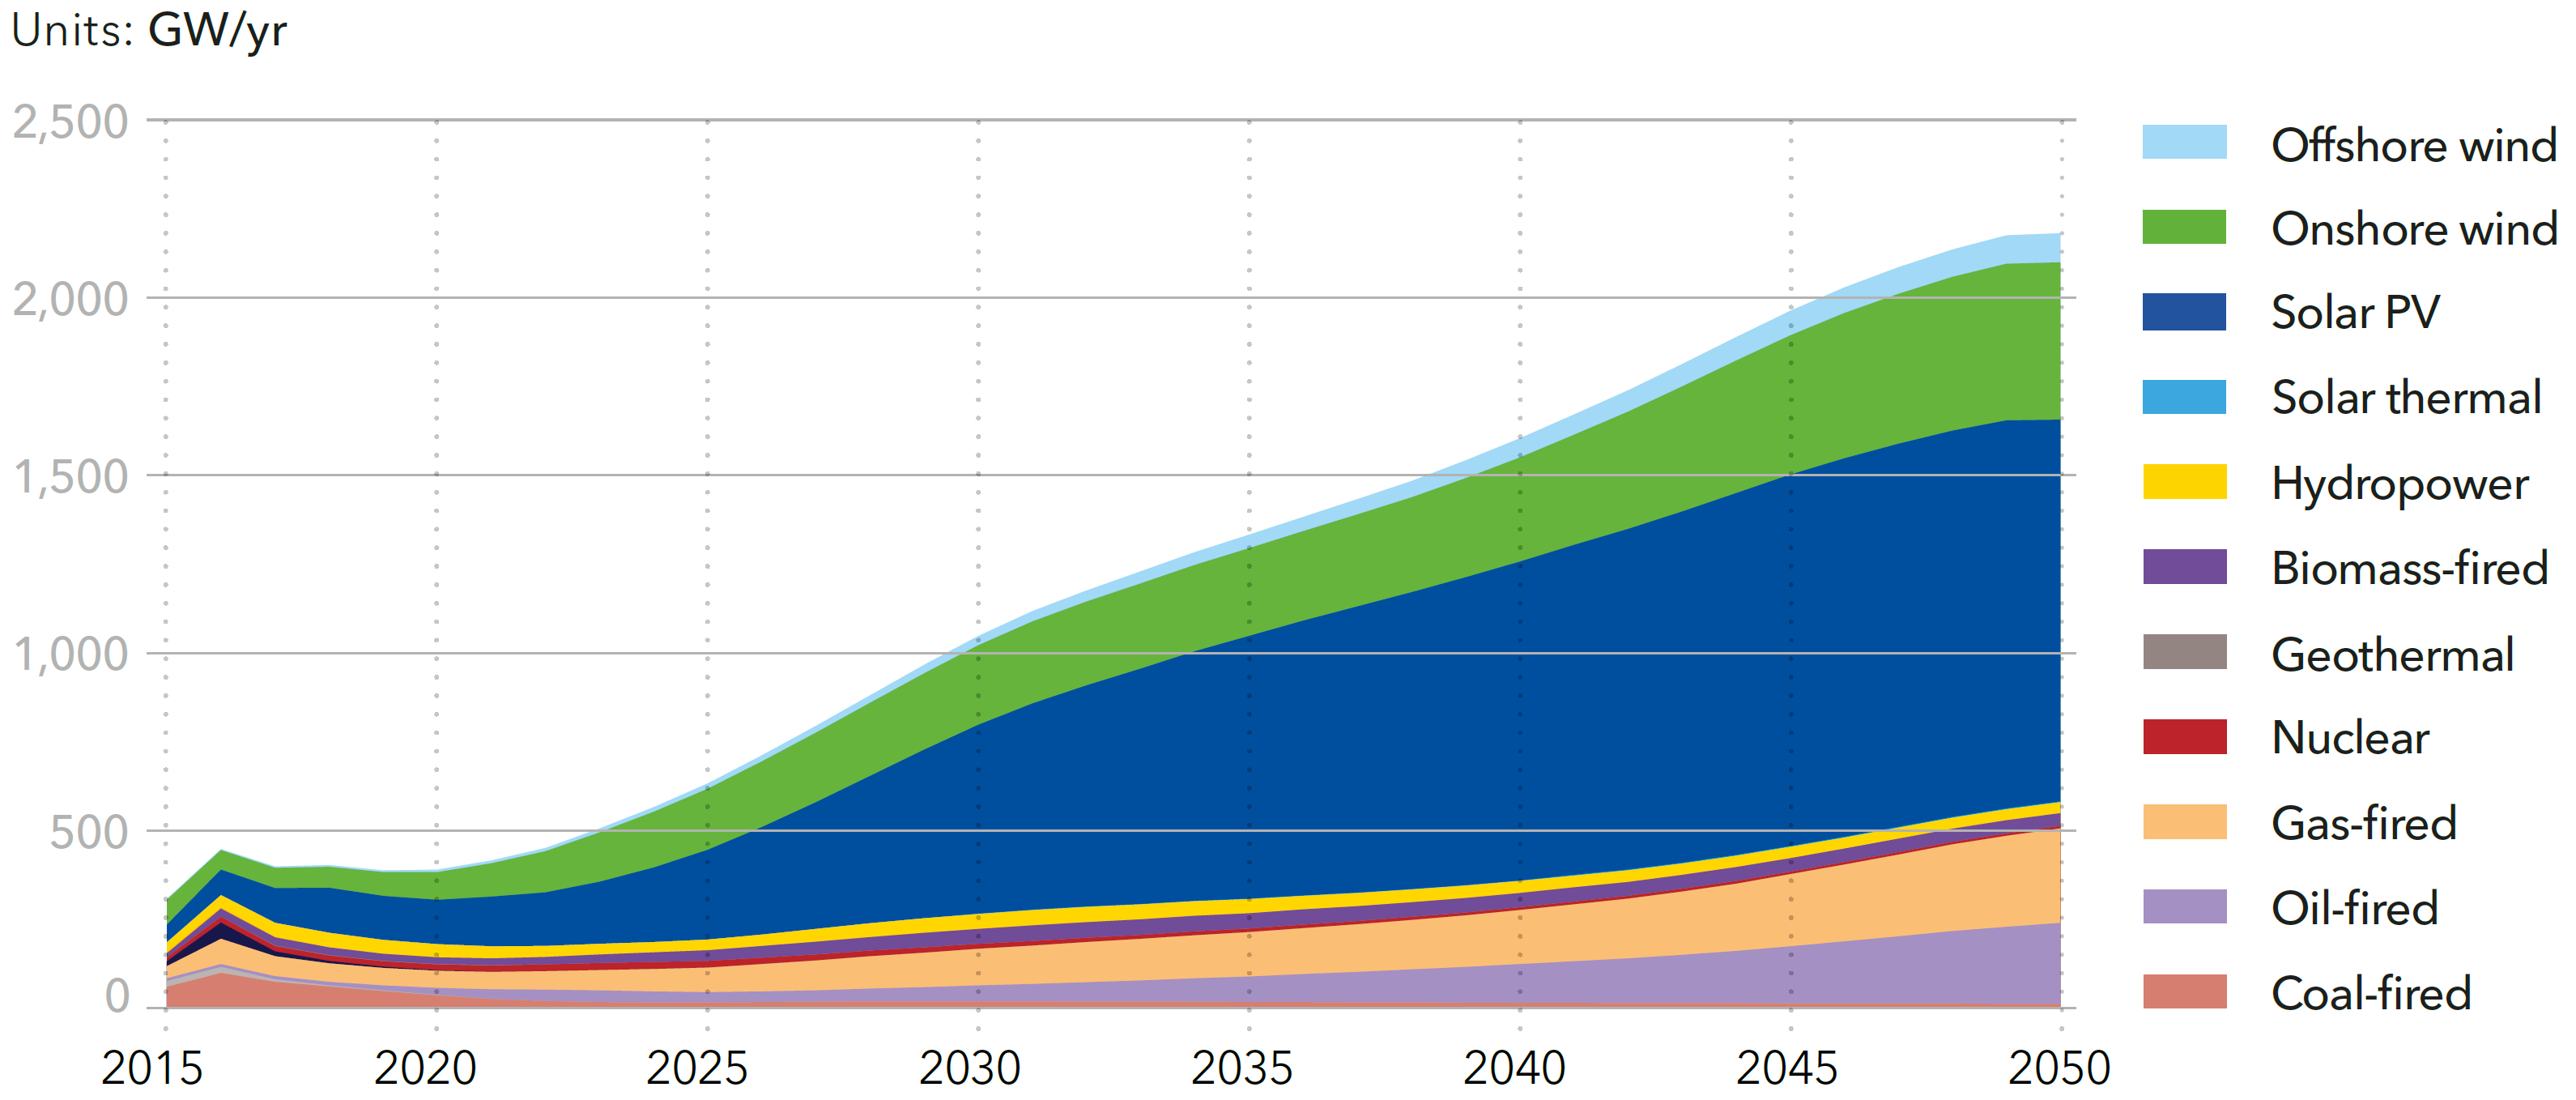
Source: DNV-GL (2018)13, Fig. 4.2.3
Global flows of energy carriers from primary energy supply to final energy demand

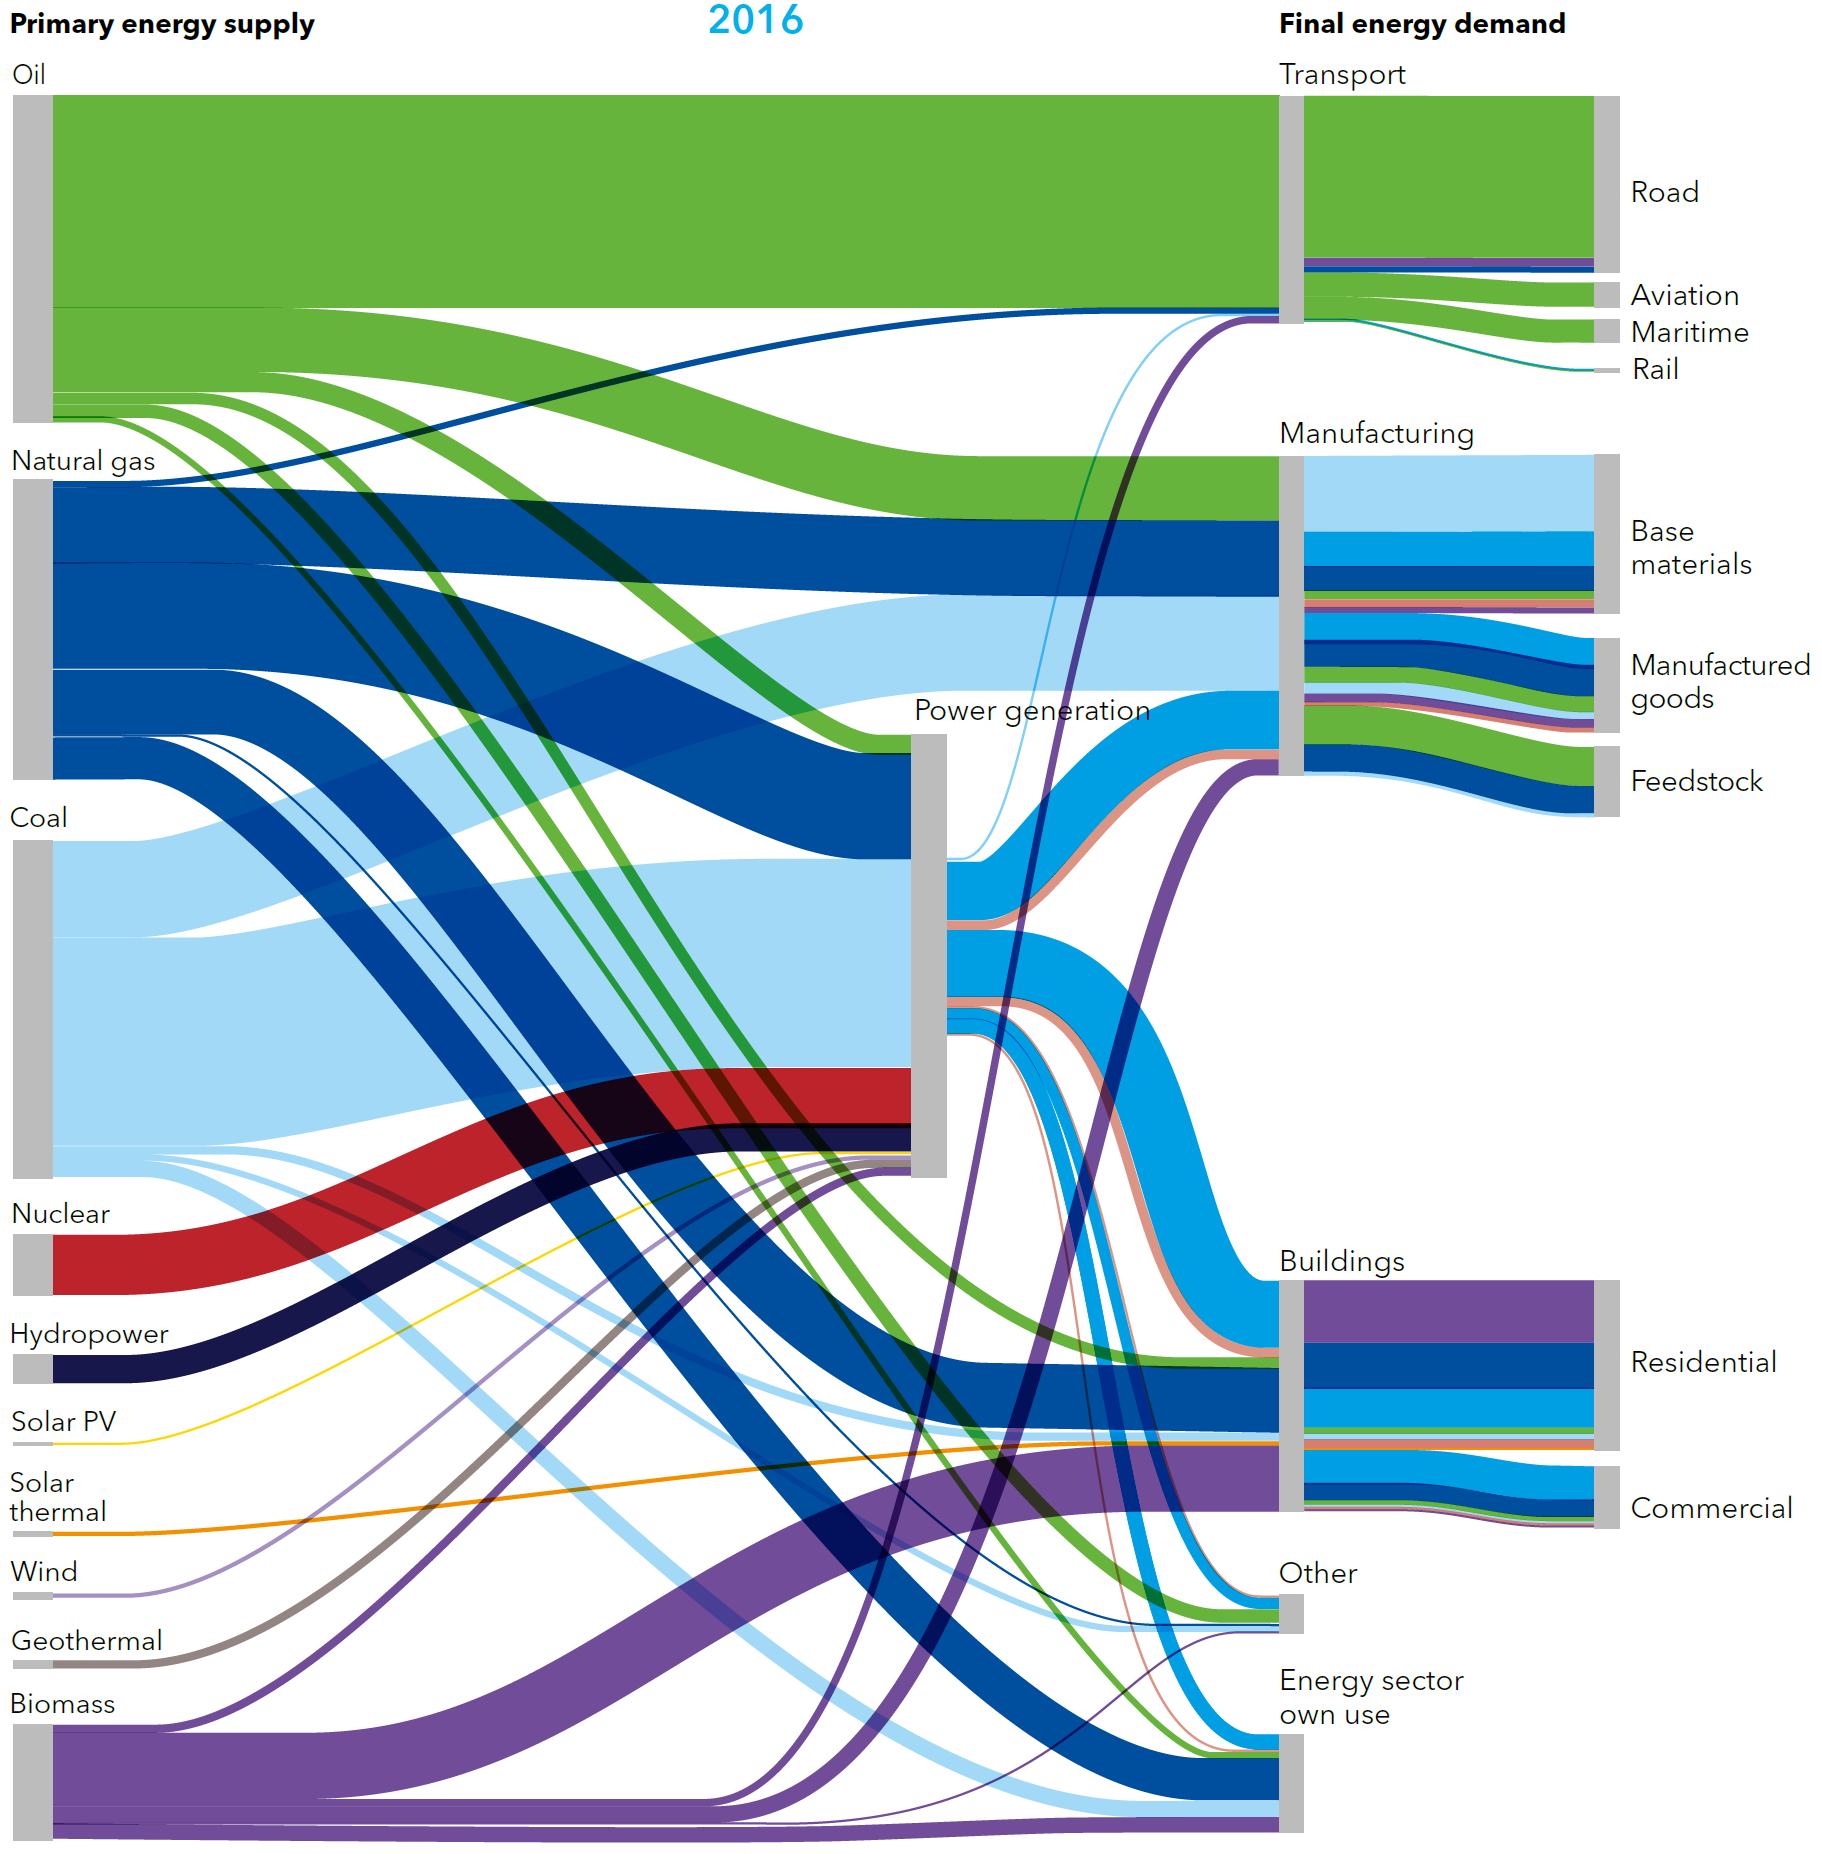
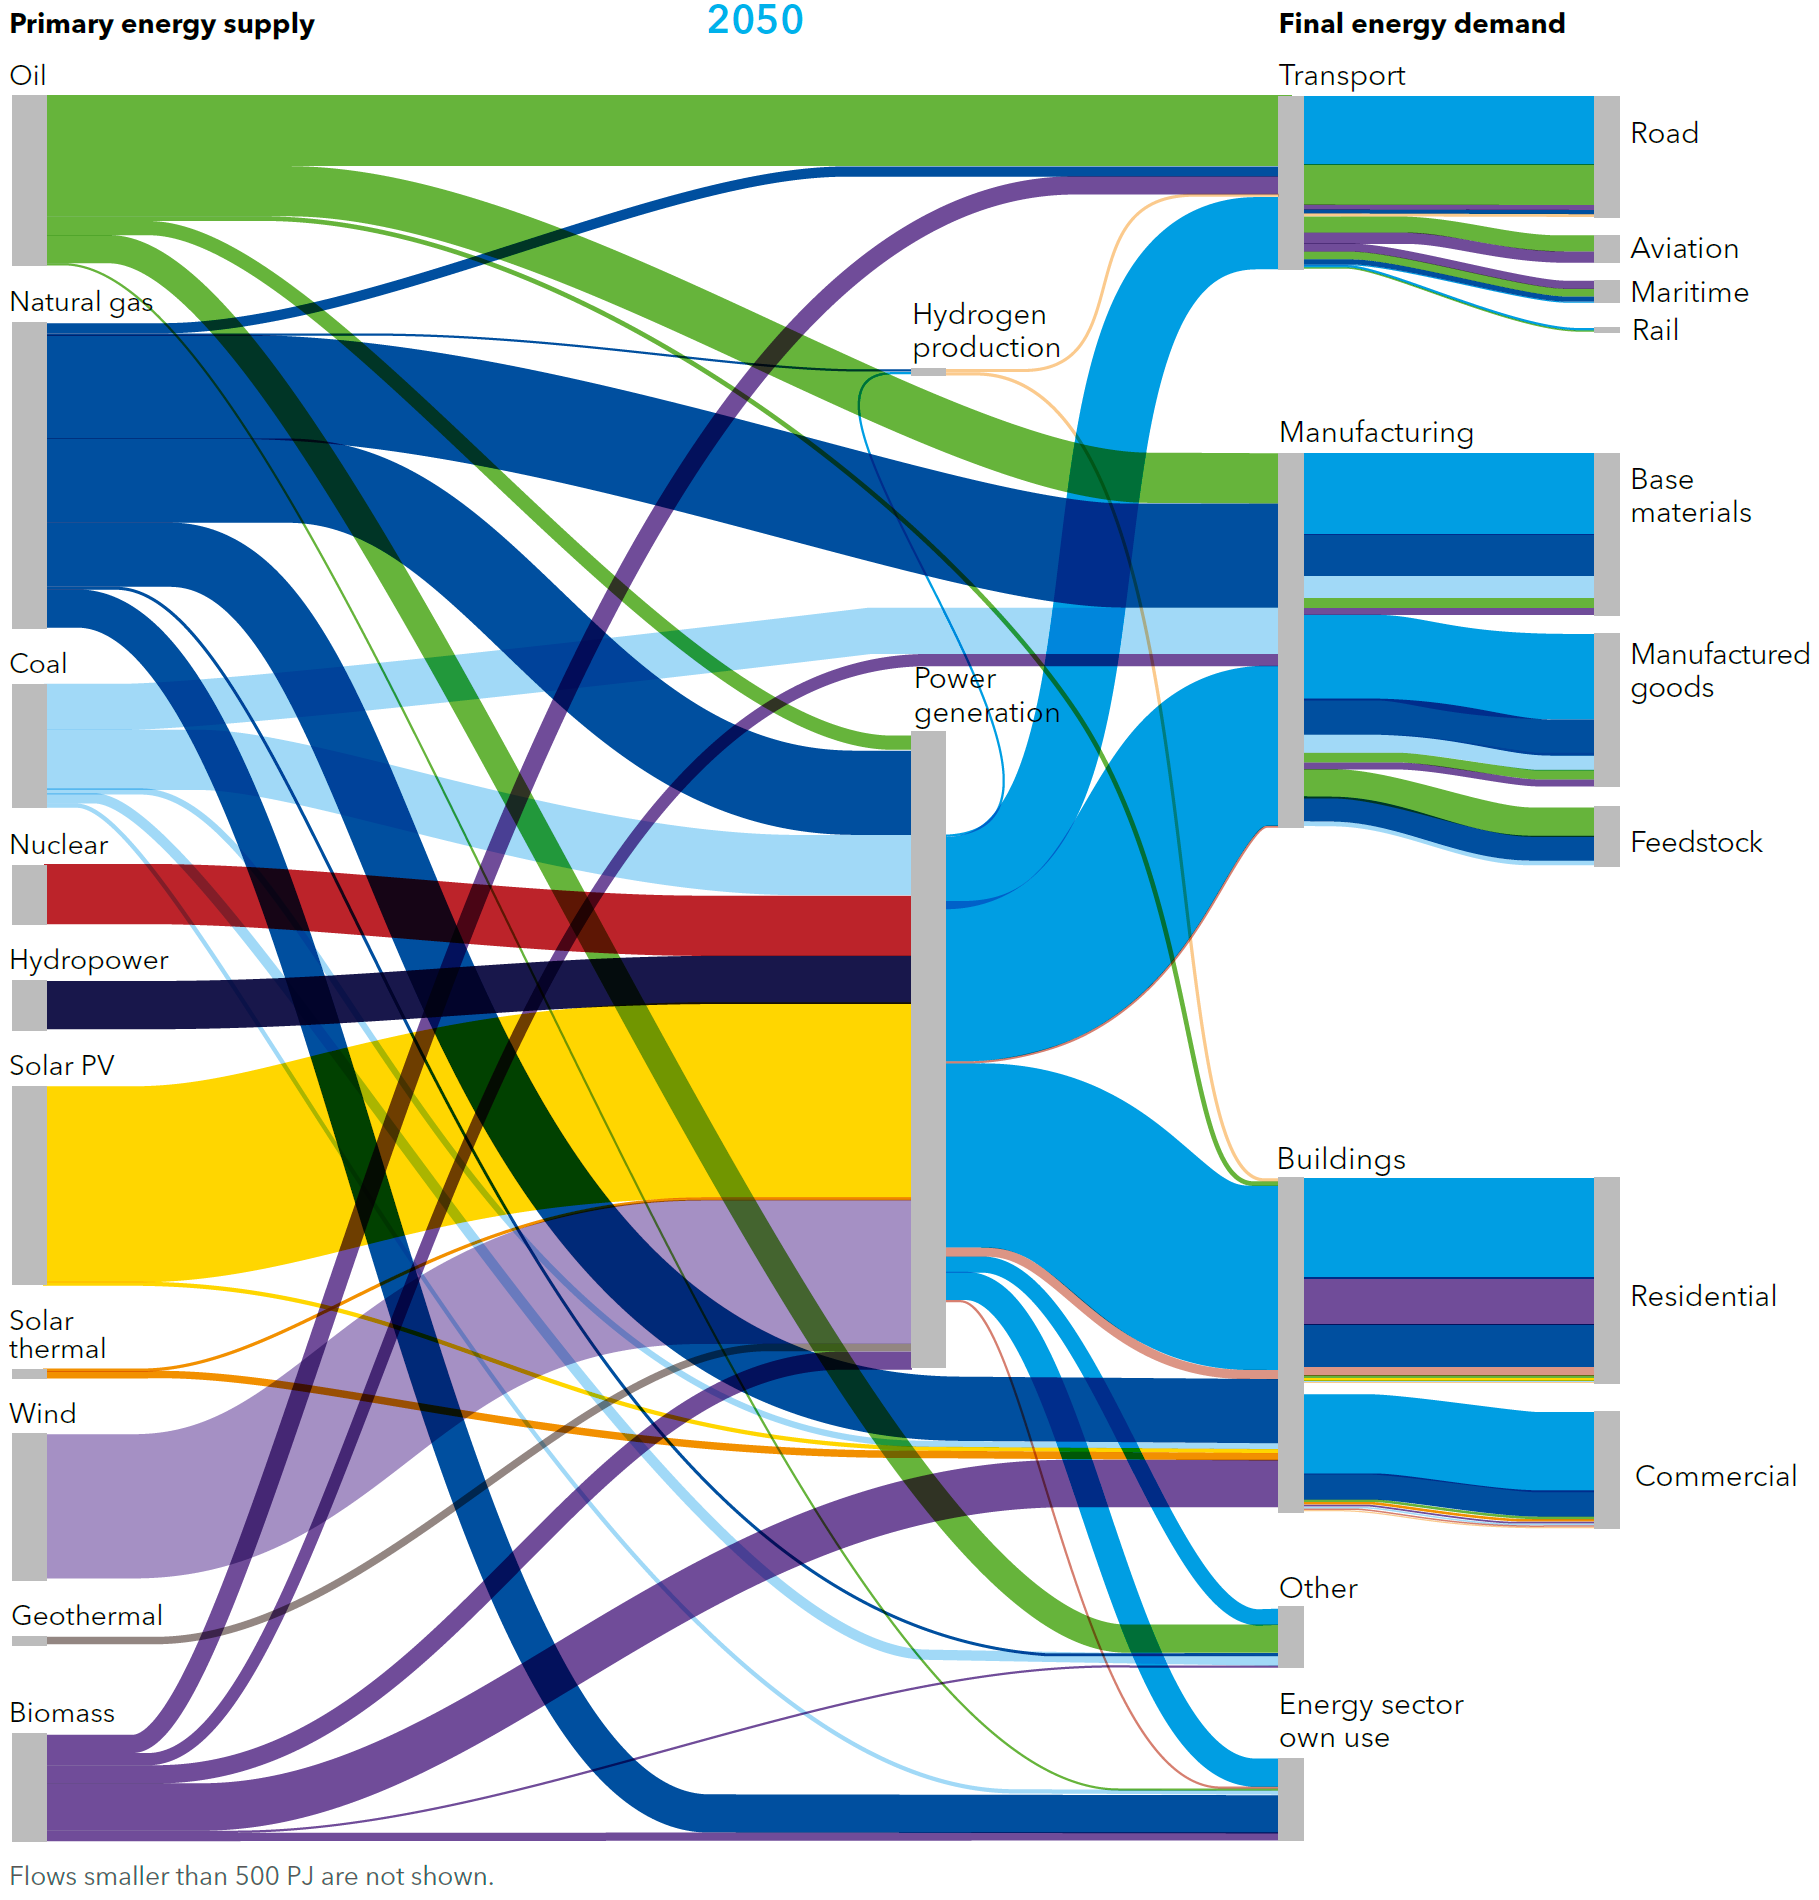
Source: DNV-GL (2018)13, Fig. 3.2
World coal demand by sector

Source: DNV-GL (2018)13, Fig. 4.3.4
World oil demand by sector
Source: DNV-GL (2018)13, Fig. 4.3.7
World natural gas demand by sector
Source: DNV-GL (2018)13, Fig. 4.3.12
World biomass demand by sector
Source: DNV-GL (2018)13, Fig. 4.3.19
Energy efficiency improvements by sector
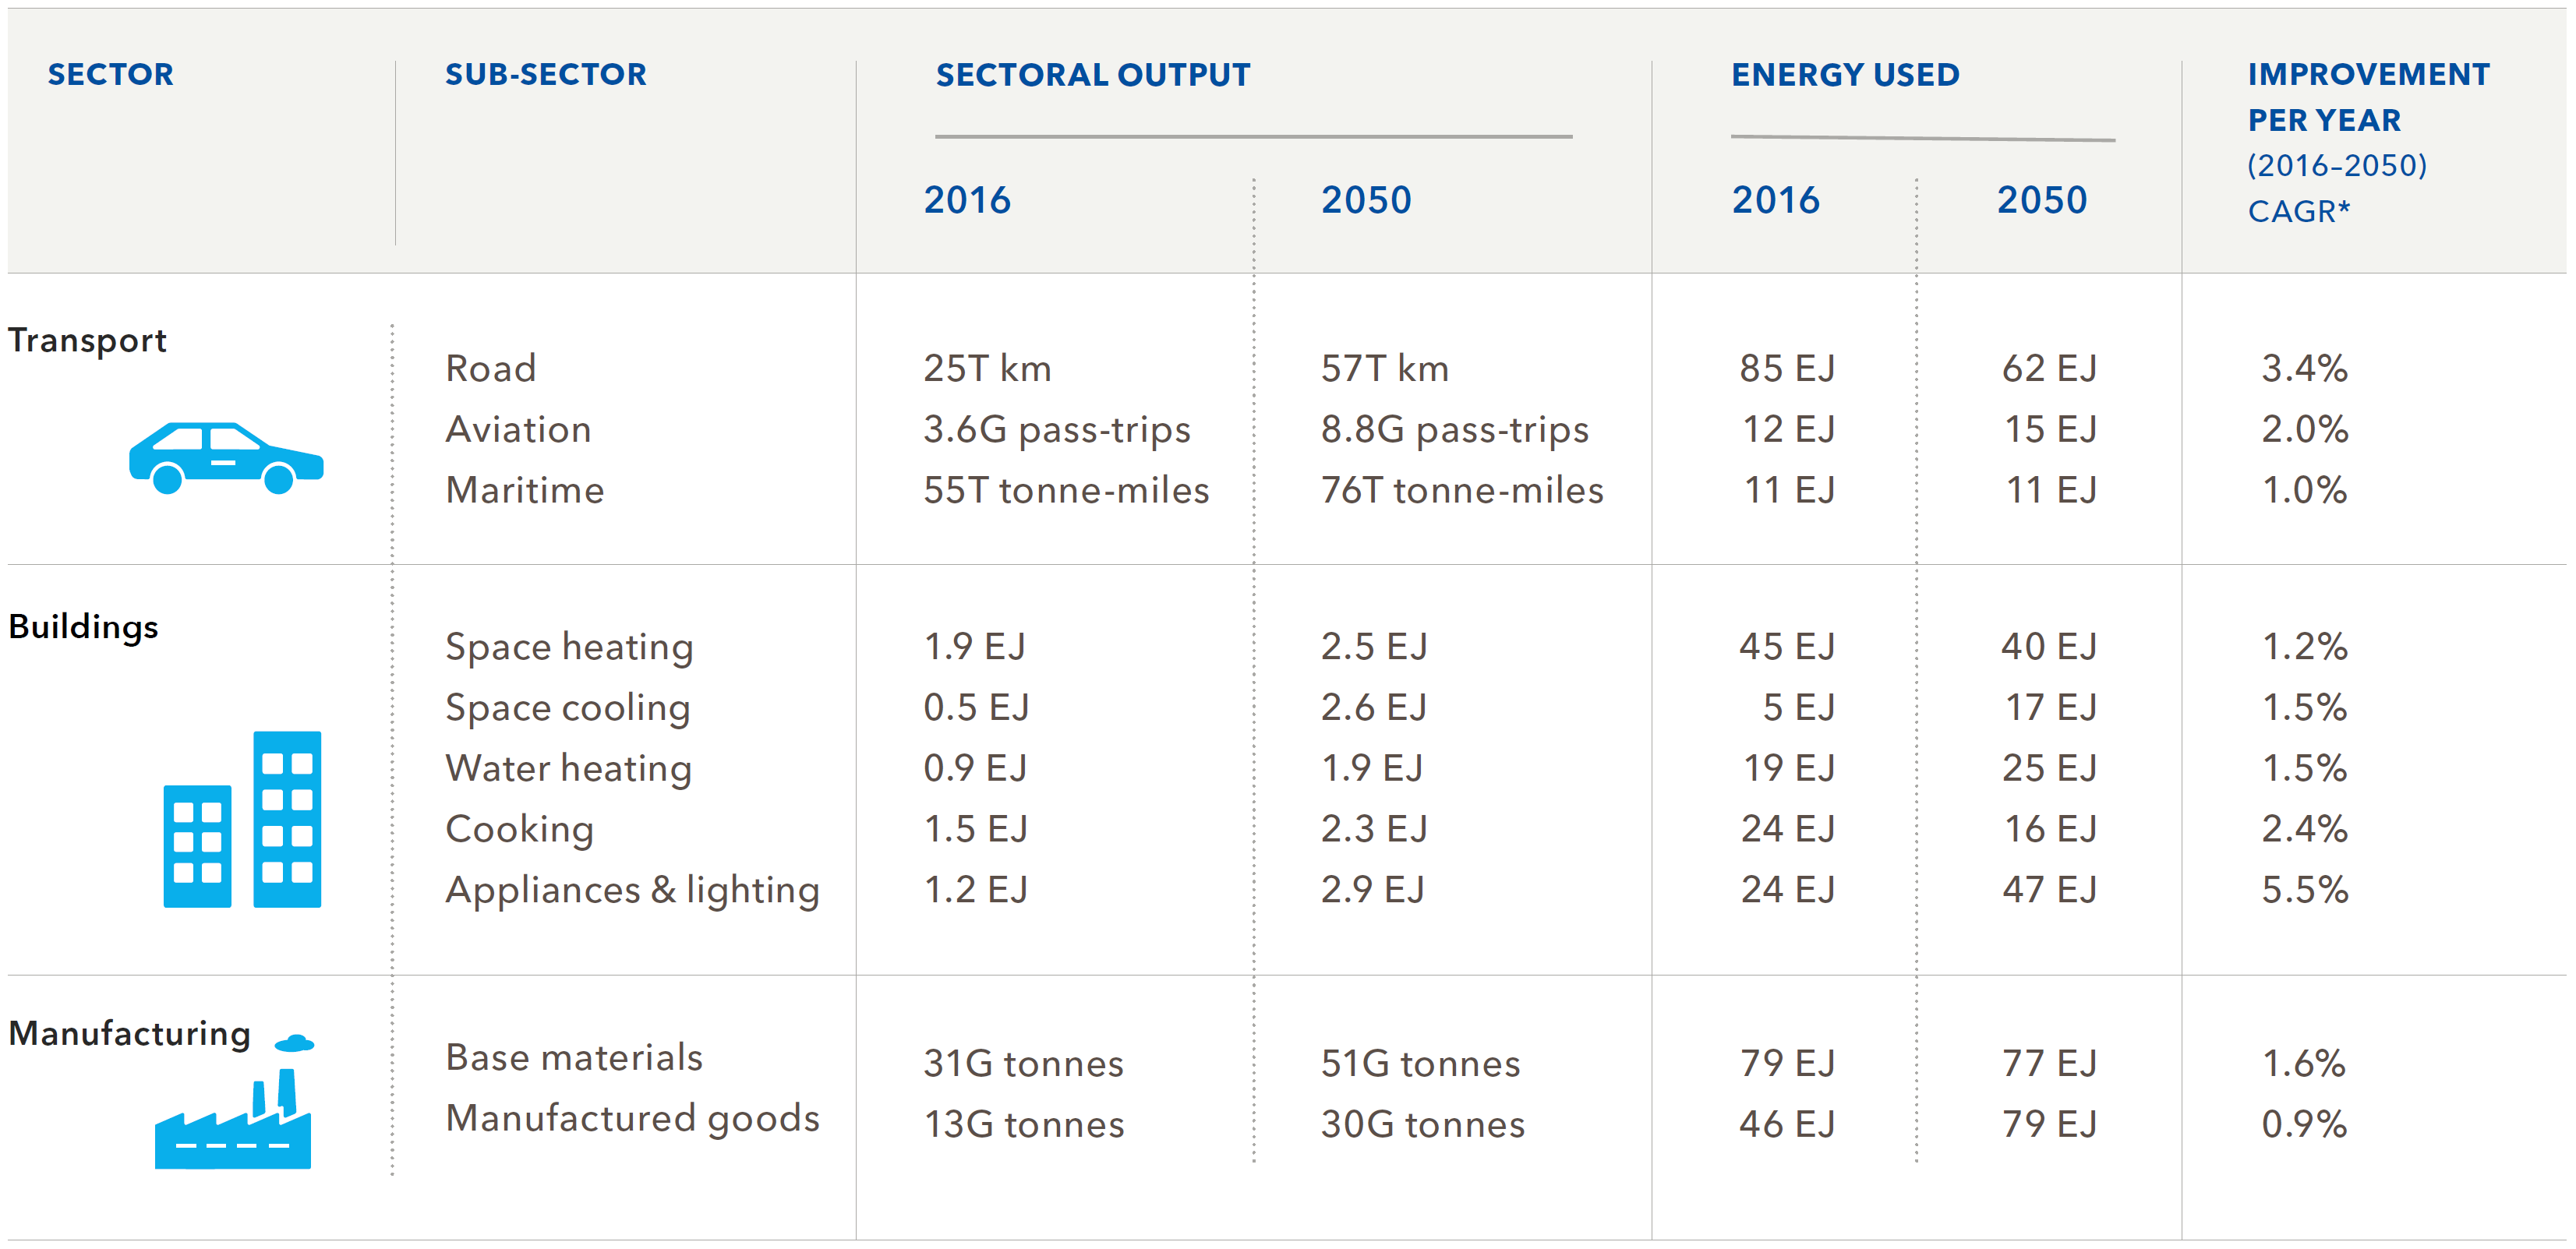
Source: DNV-GL (2018)13, Fig. 4.6.1
* CAGR is compound annual growth rate.
A ‘green-growth’ scenario (SSP1) for 2°C warming (2.6 W/m2 forcing)
Global CO2 emissions – sectoral composition GtCO2/yr (SSP1, 2.6W/m2)

Source: Bauer et al (2017)2, Fig. S9
Global primary energy mix EJ/yr (SSP1, 2.6W/m2)

Source: Bauer et al (2017)1, Fig. 5a
Global final energy mix EJ/yr (SSP1, 2.6W/m2)

Source: Bauer et al (2017)1, Fig. 4a
Global power generation by technology EJ/yr (SSP1, 2.6W/m2)

Source: Bauer et al (2017)1, Fig. 7
Global transport sector energy demand mix EJ/yr (SSP1, 2.6W/m2)
![]()
Source: Bauer et al (2017)2, Fig. S13
Global production mix of liquid fuels by technology and primary energy source EJ/yr (SSP1, 2.6W/m2)

Source: Bauer et al (2017)2, Fig. S14
Global mix of bio-fuel production from bio-energy differentiated by secondary energy carrier EJ/yr (SSP1, 2.6W/m2)

Source: Bauer et al (2017)2, Fig. S15
One Earth Climate Model
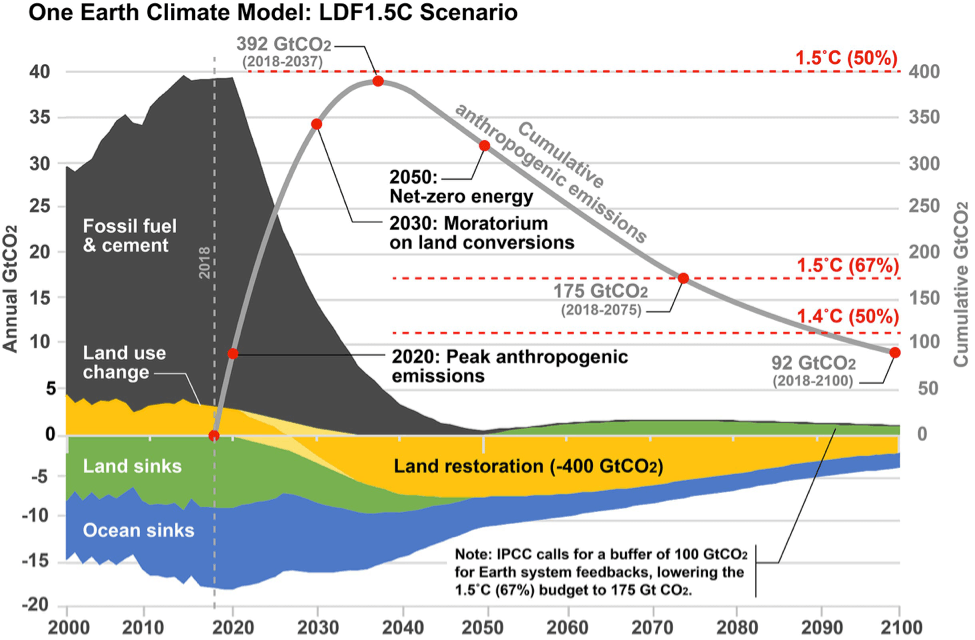
Source: https://www.leonardodicaprio.org/one-earth-climate-model/9
“The One Earth climate model (LDF 1.5 scenario) documented in Achieving the Paris Climate Agreement Goals (Teske, ed. 2019), shows the possibility of staying below the 1.5˚C climate threshold. The IPCC special report Global Warming of 1.5˚C (SR1.5) calls for a carbon budget of 400 GtCO2 to maintain a chance of staying below the threshold of 1.5˚C in global average temperature rise, adjusted to account for additional warming since the beginning of the industrial era (circa 1750). The budget for a good chance (>67%) of 1.5˚C is 175 GtCO2, accounting for a buffer of 100 GtCO2 for biosphere feedbacks in the second half of the century, such as melting permafrost, which is achieved by 2075. This is the first climate model to offer a chance of lowering global temperatures to 1.4˚C by the end of the century without geoengineering.”
Source: https://www.leonardodicaprio.org/one-earth-climate-model/9
Global CO2 emissions by sector and cumulative emissions (since 2015) in the scenarios
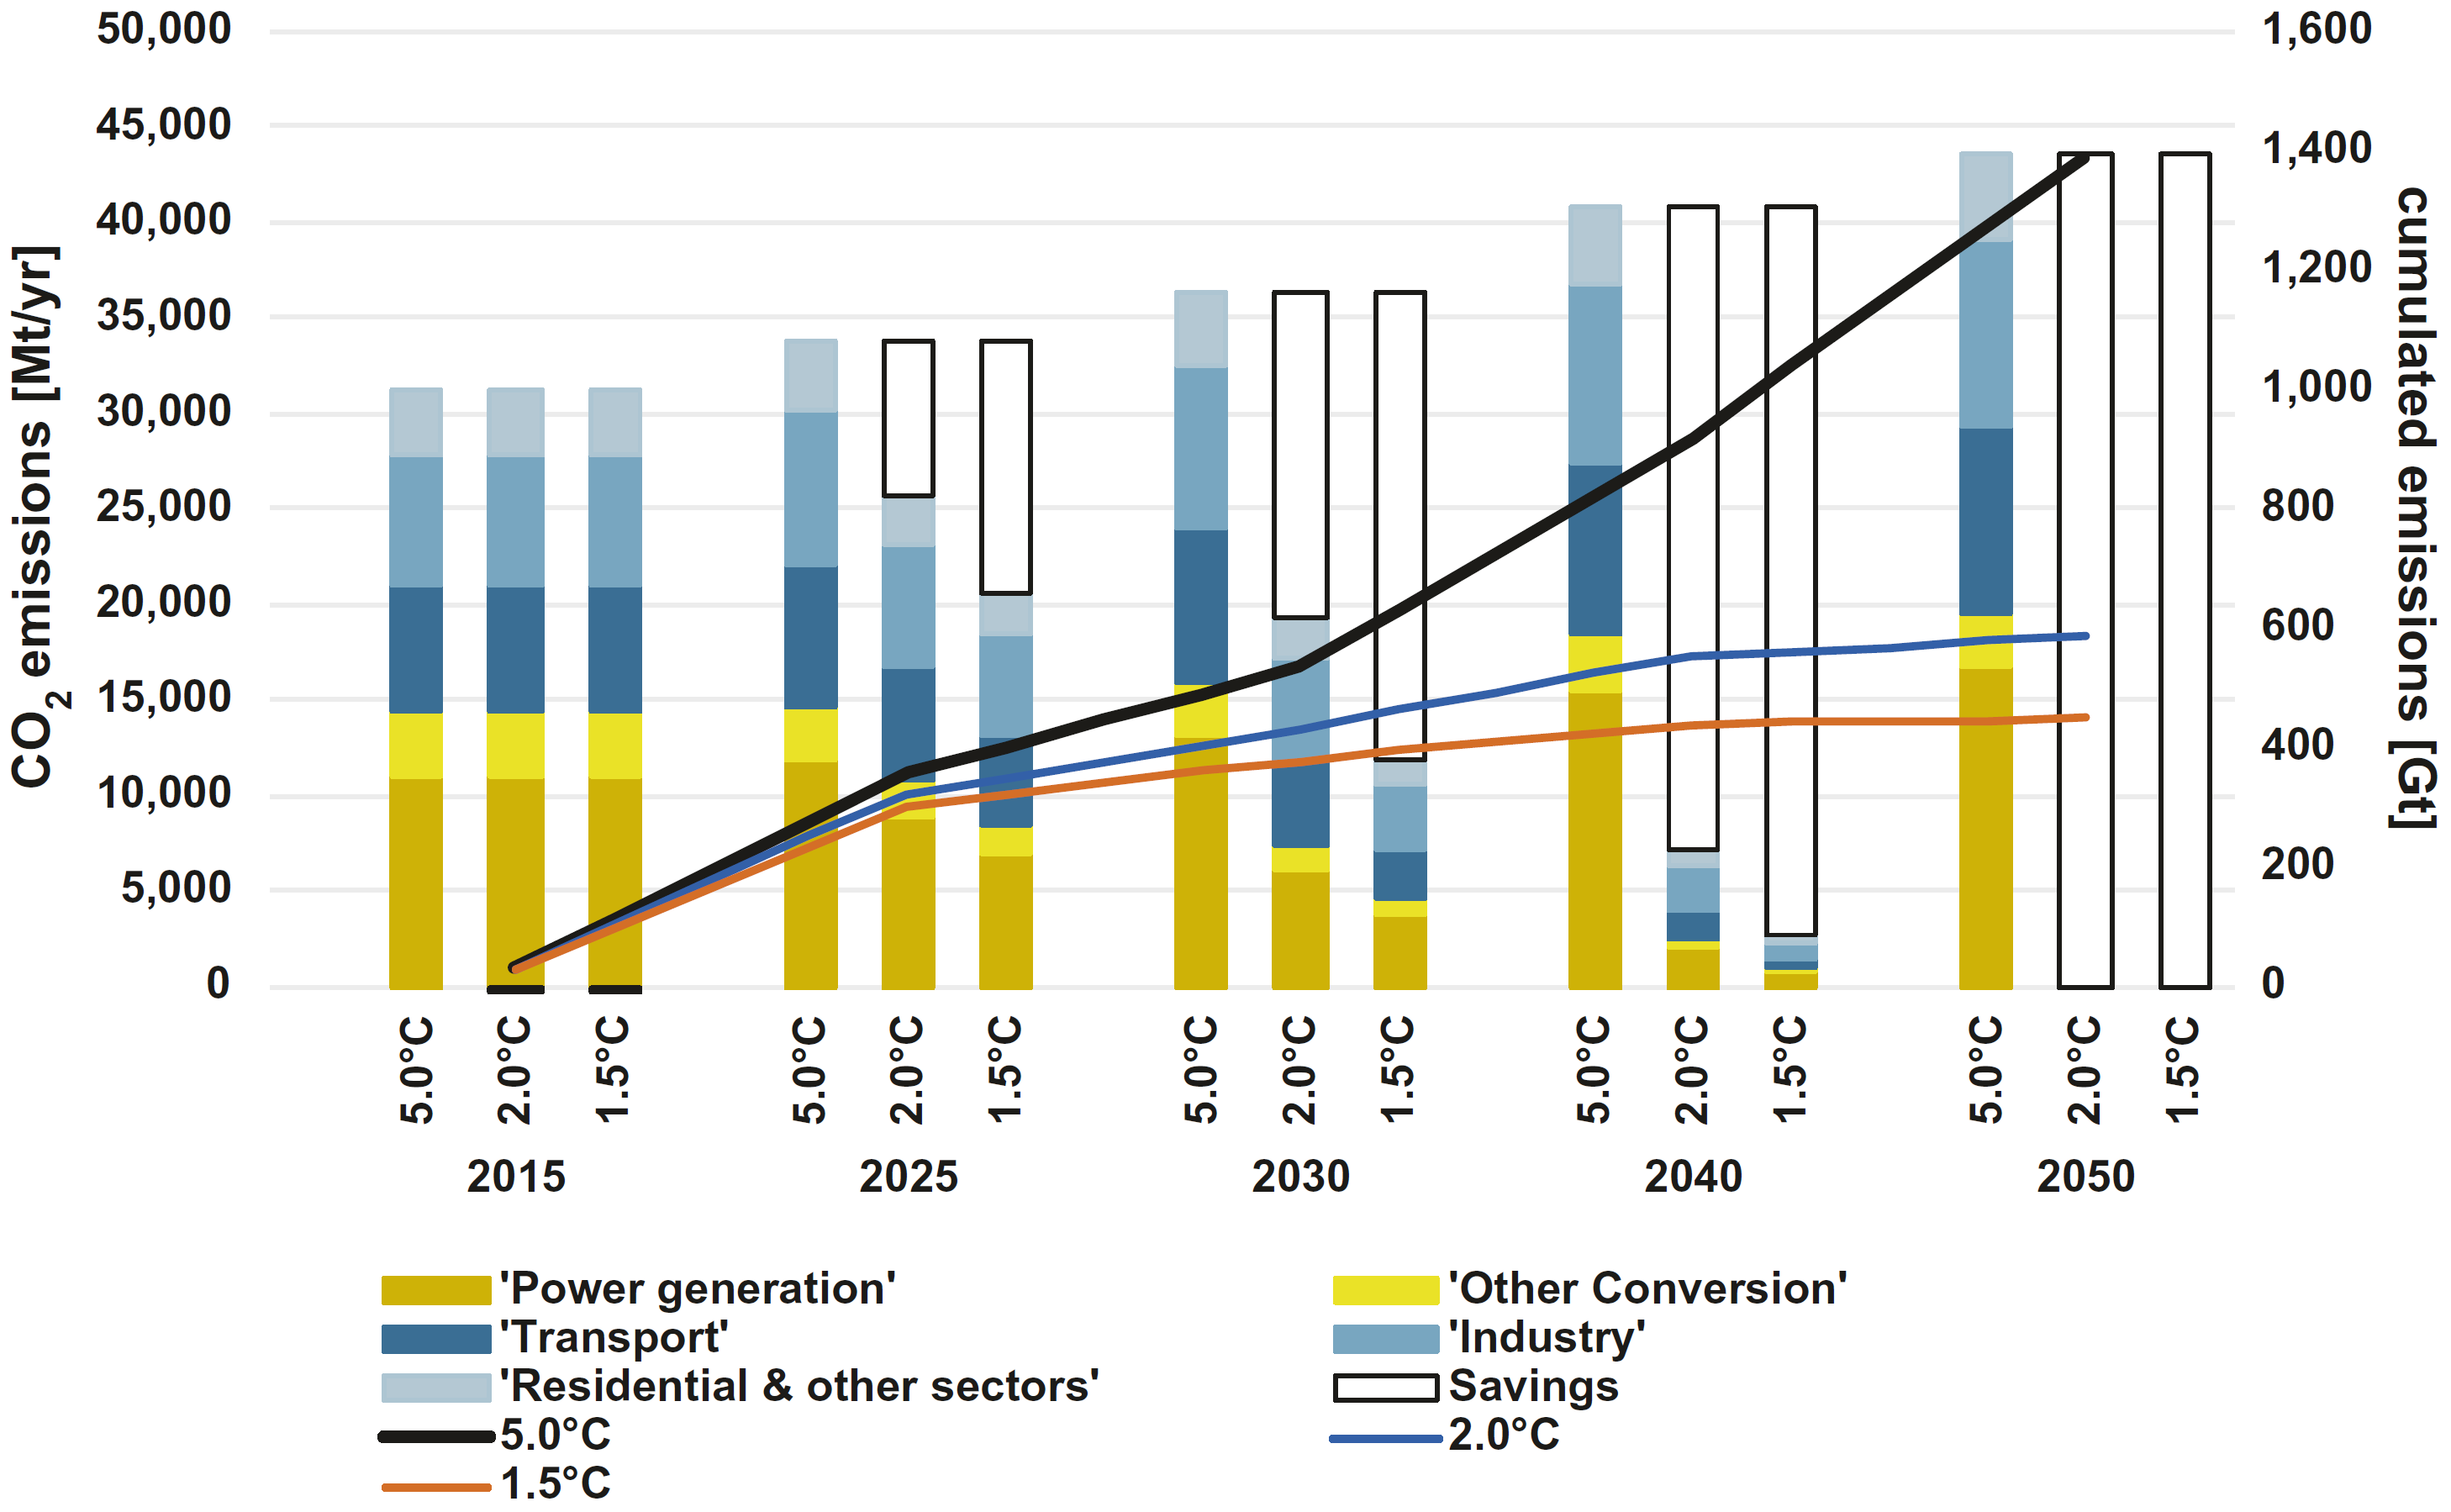
Source: Teske (2019)12, Fig. 8.13
Where ‘Savings’ represents a lower level than in the 5.0°C scenario.
Global total primary energy demand by energy carrier in the scenarios
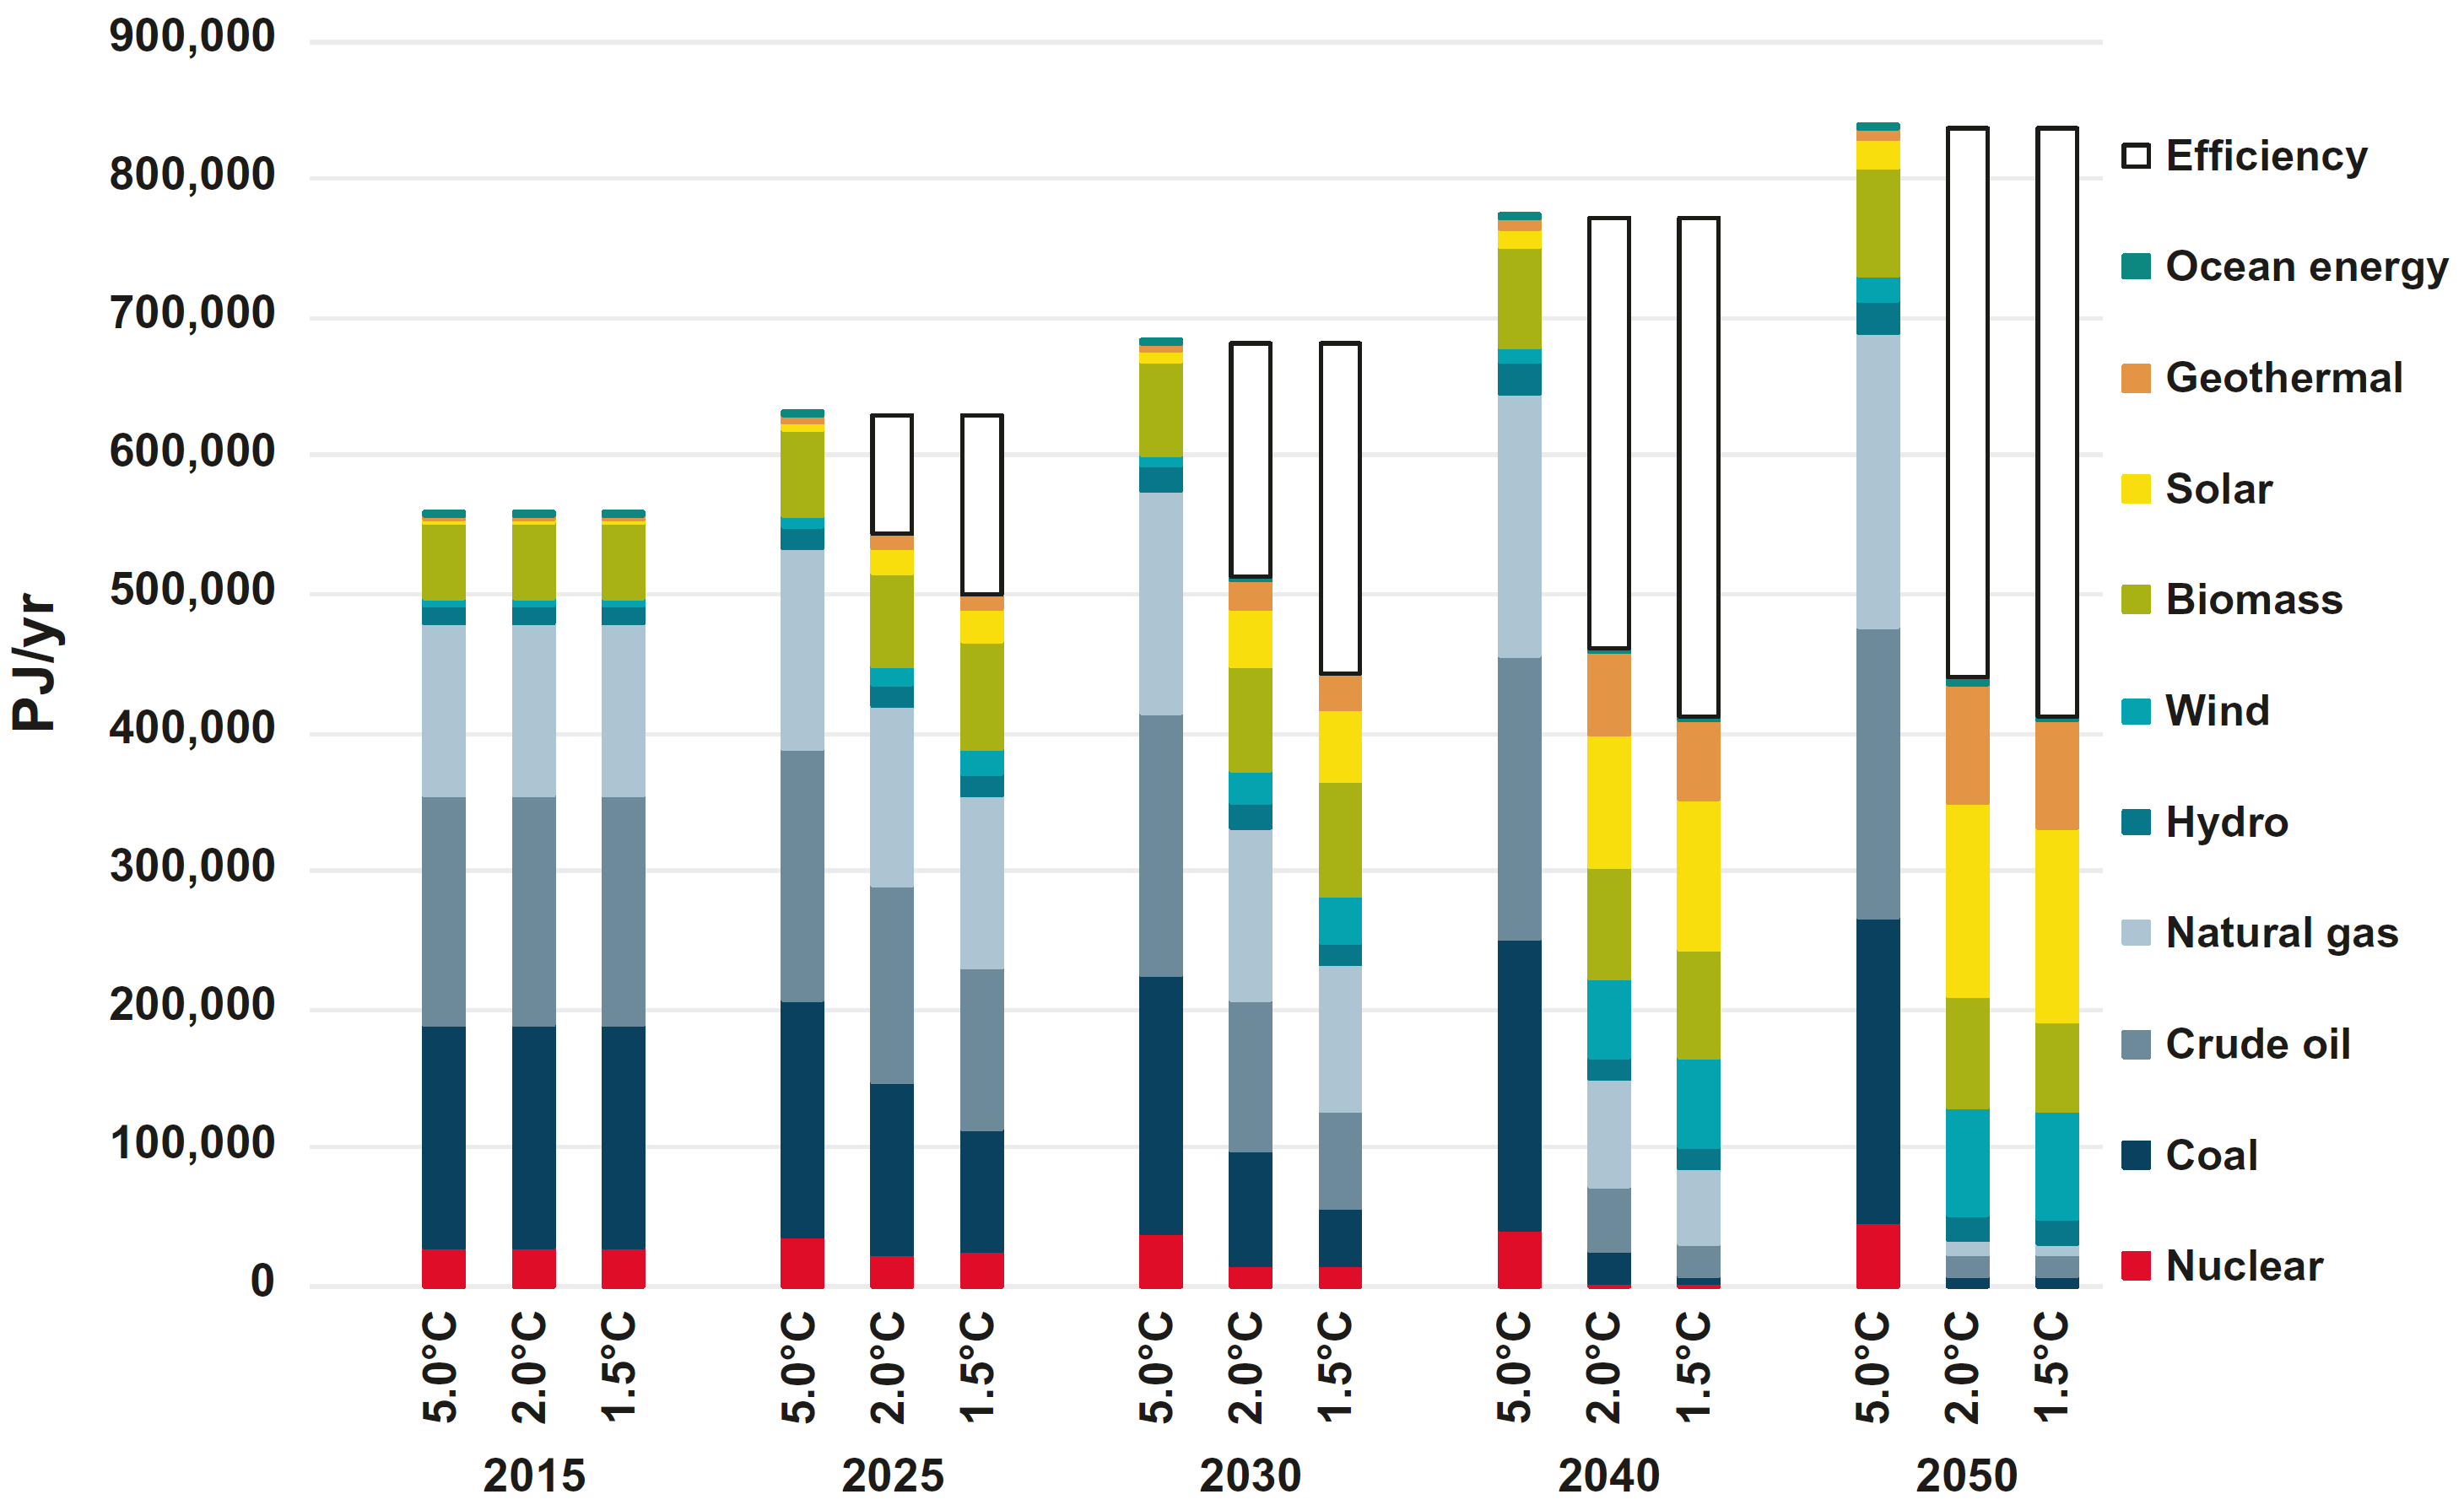
Source: Teske (2019)12, Fig. 8.14
Global final energy demand by sector in the scenarios
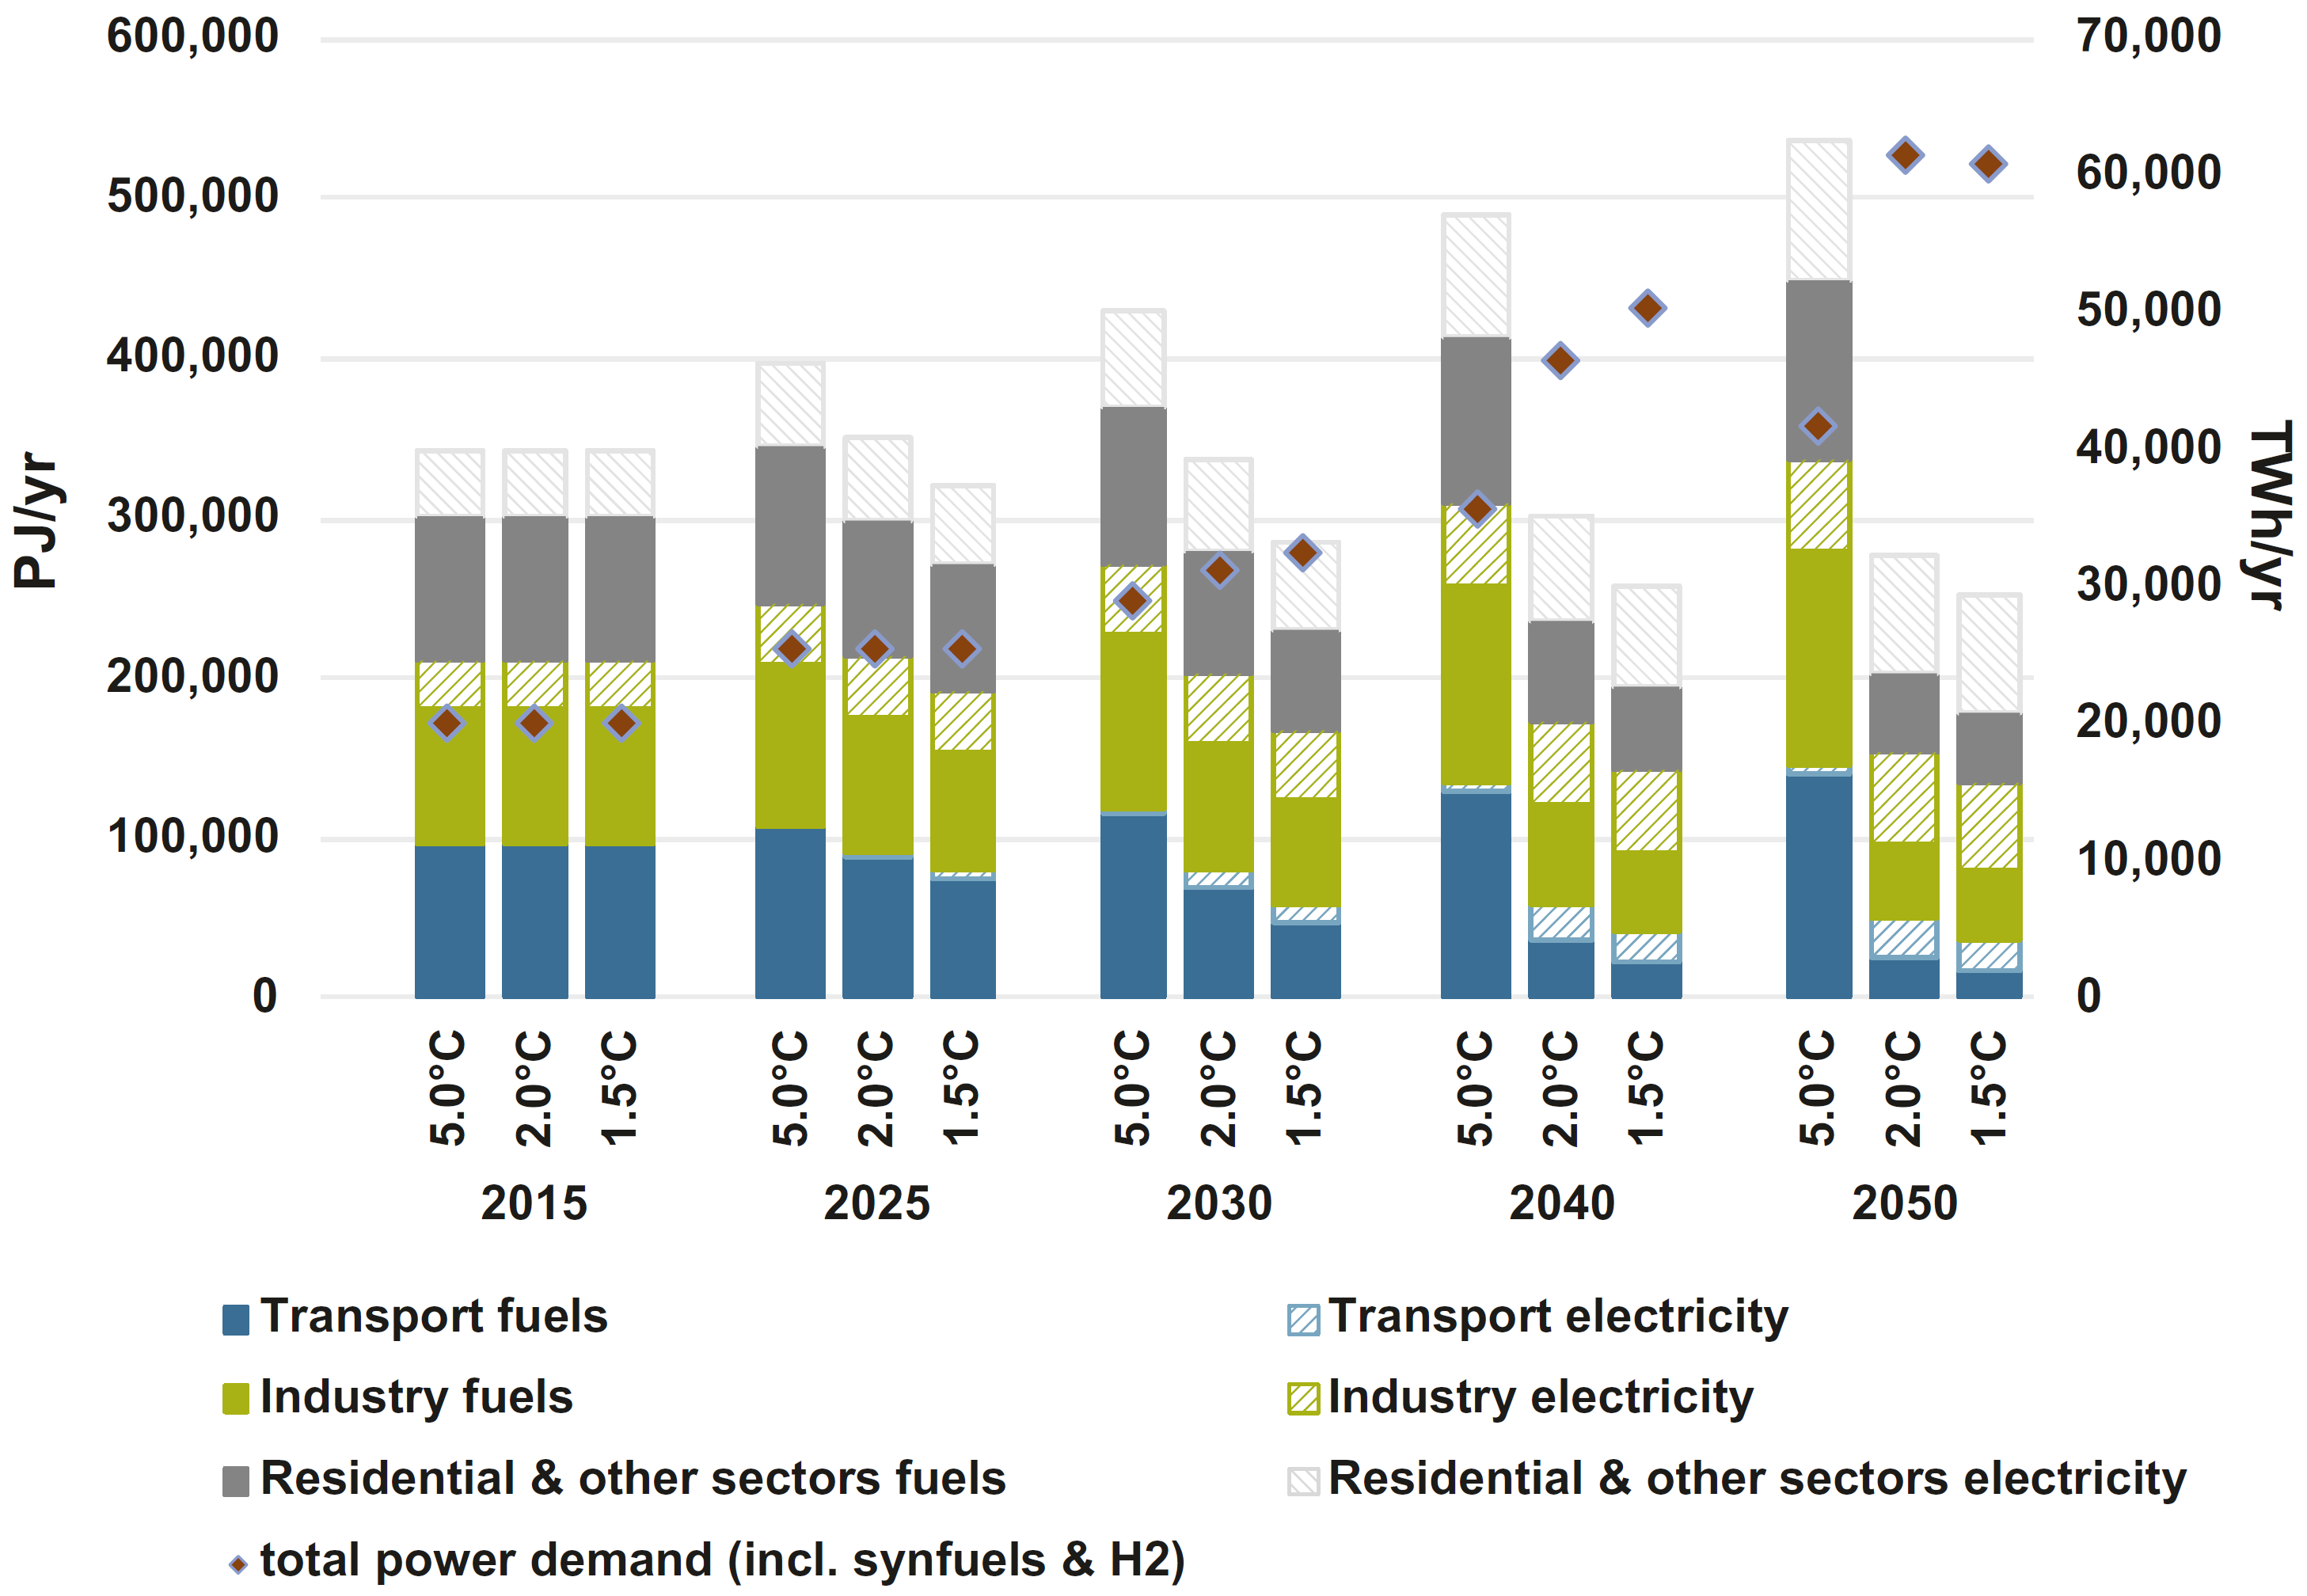
Source: Teske (2019)12, Fig. 8.6
Global electricity-generation in the scenarios
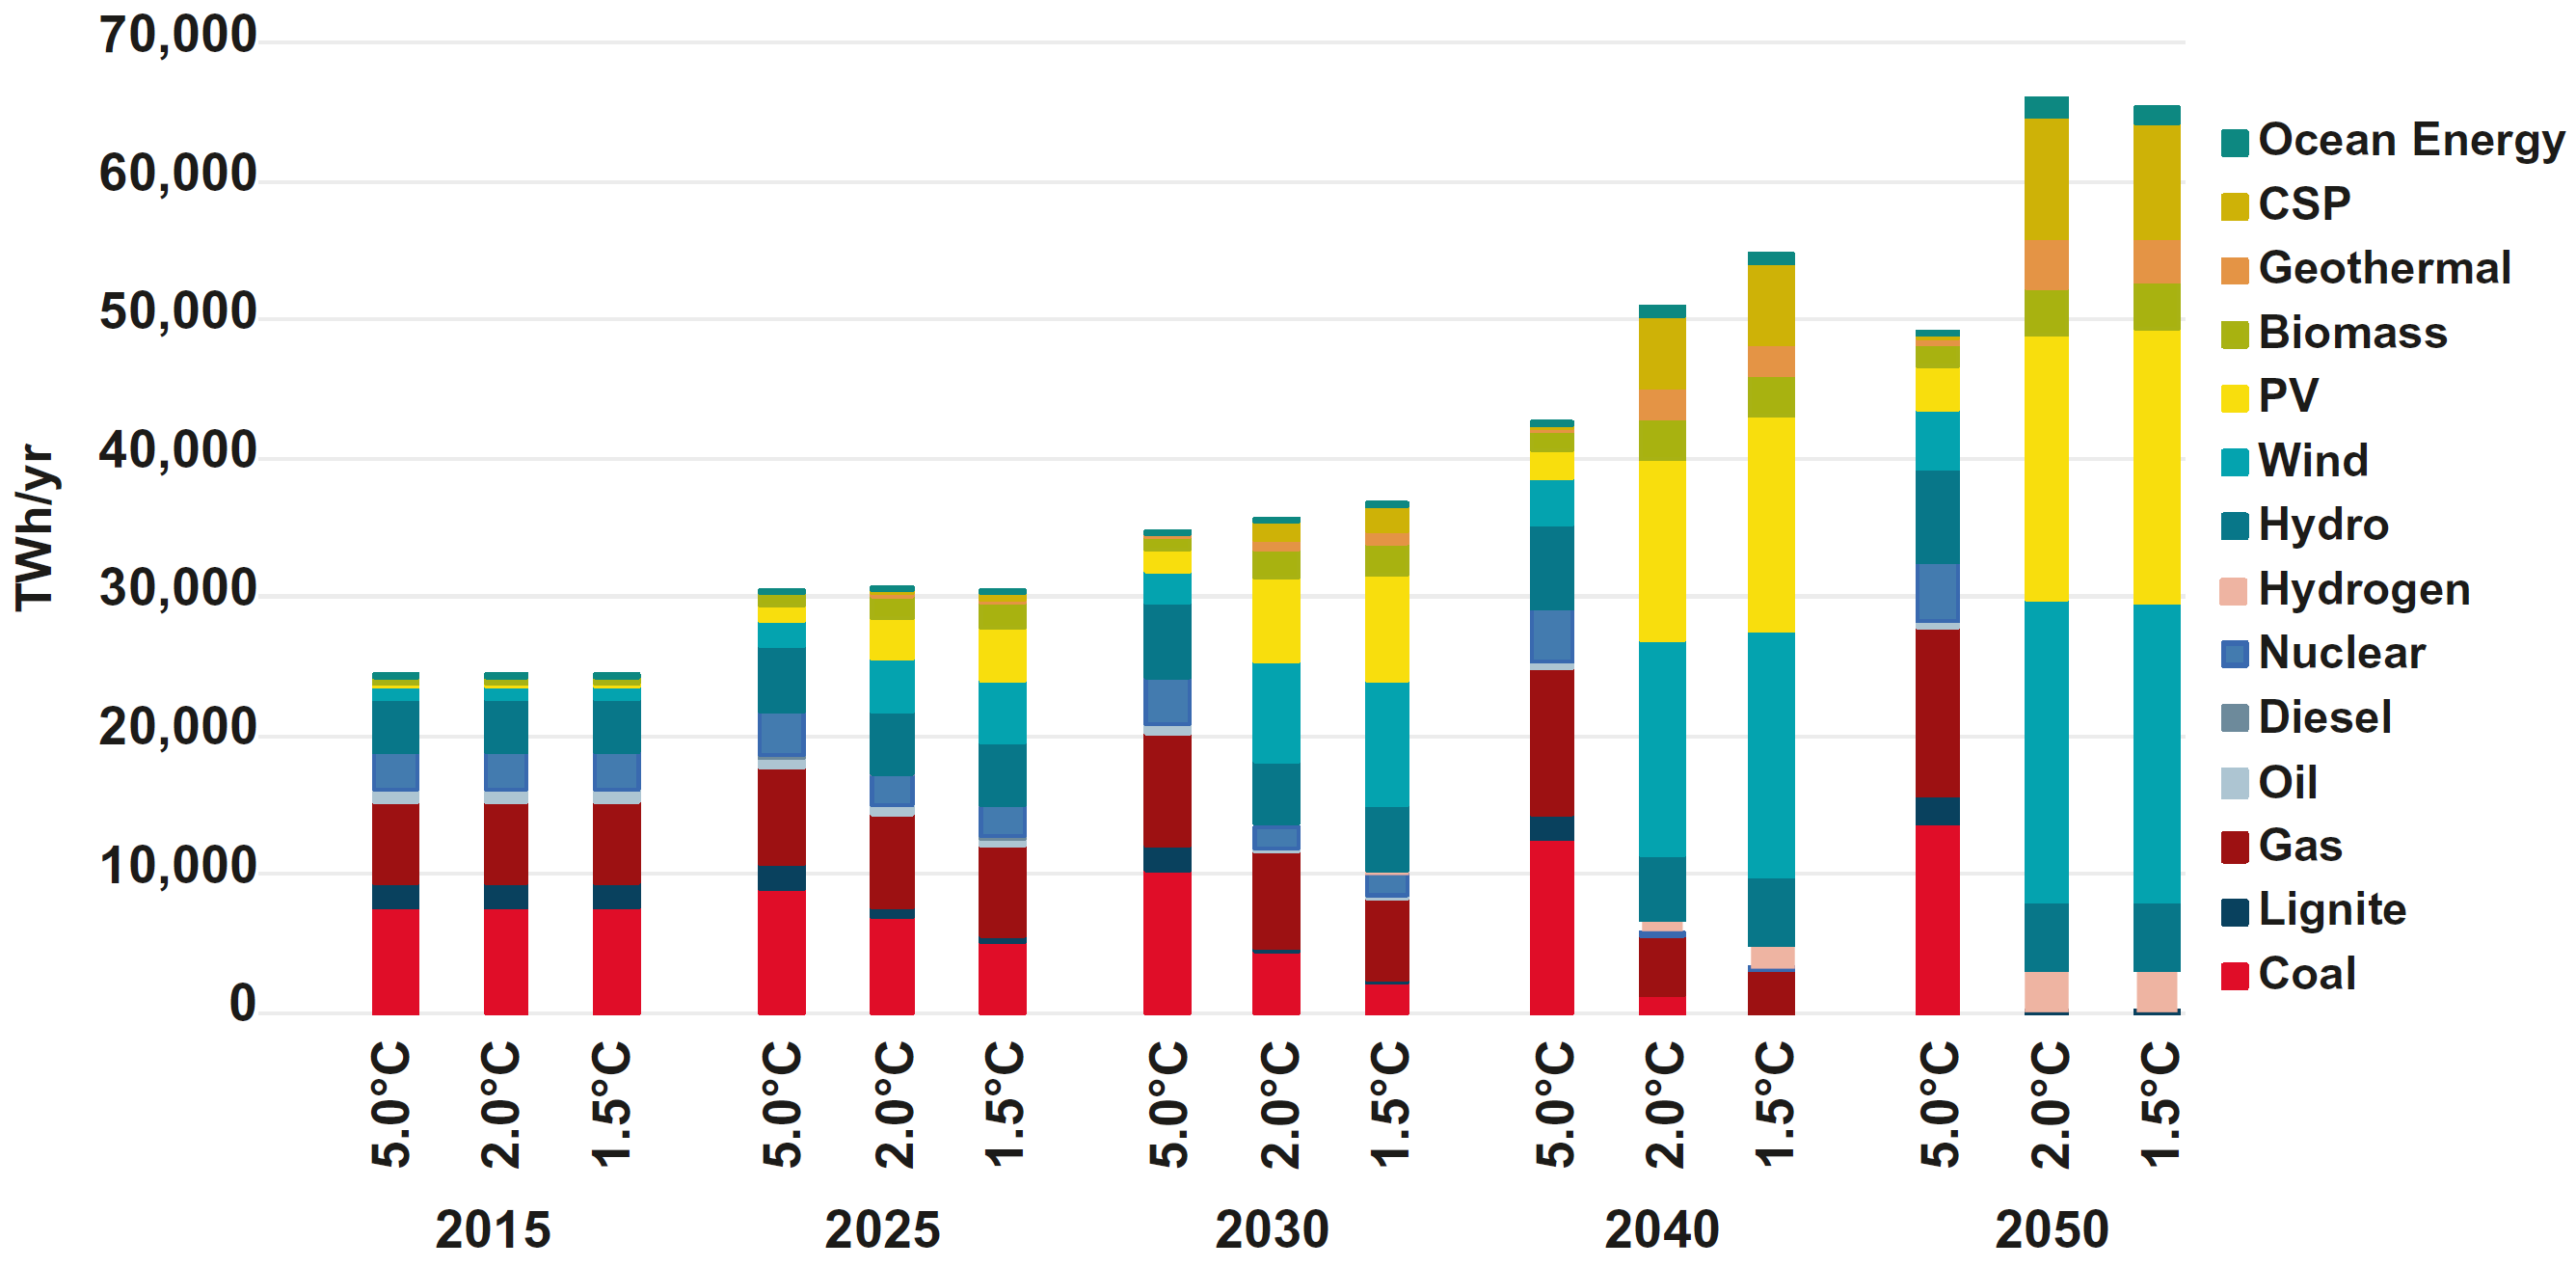
Source: Teske (2019)12, Fig. 8.7
Global heat supply by energy carrier in the scenarios
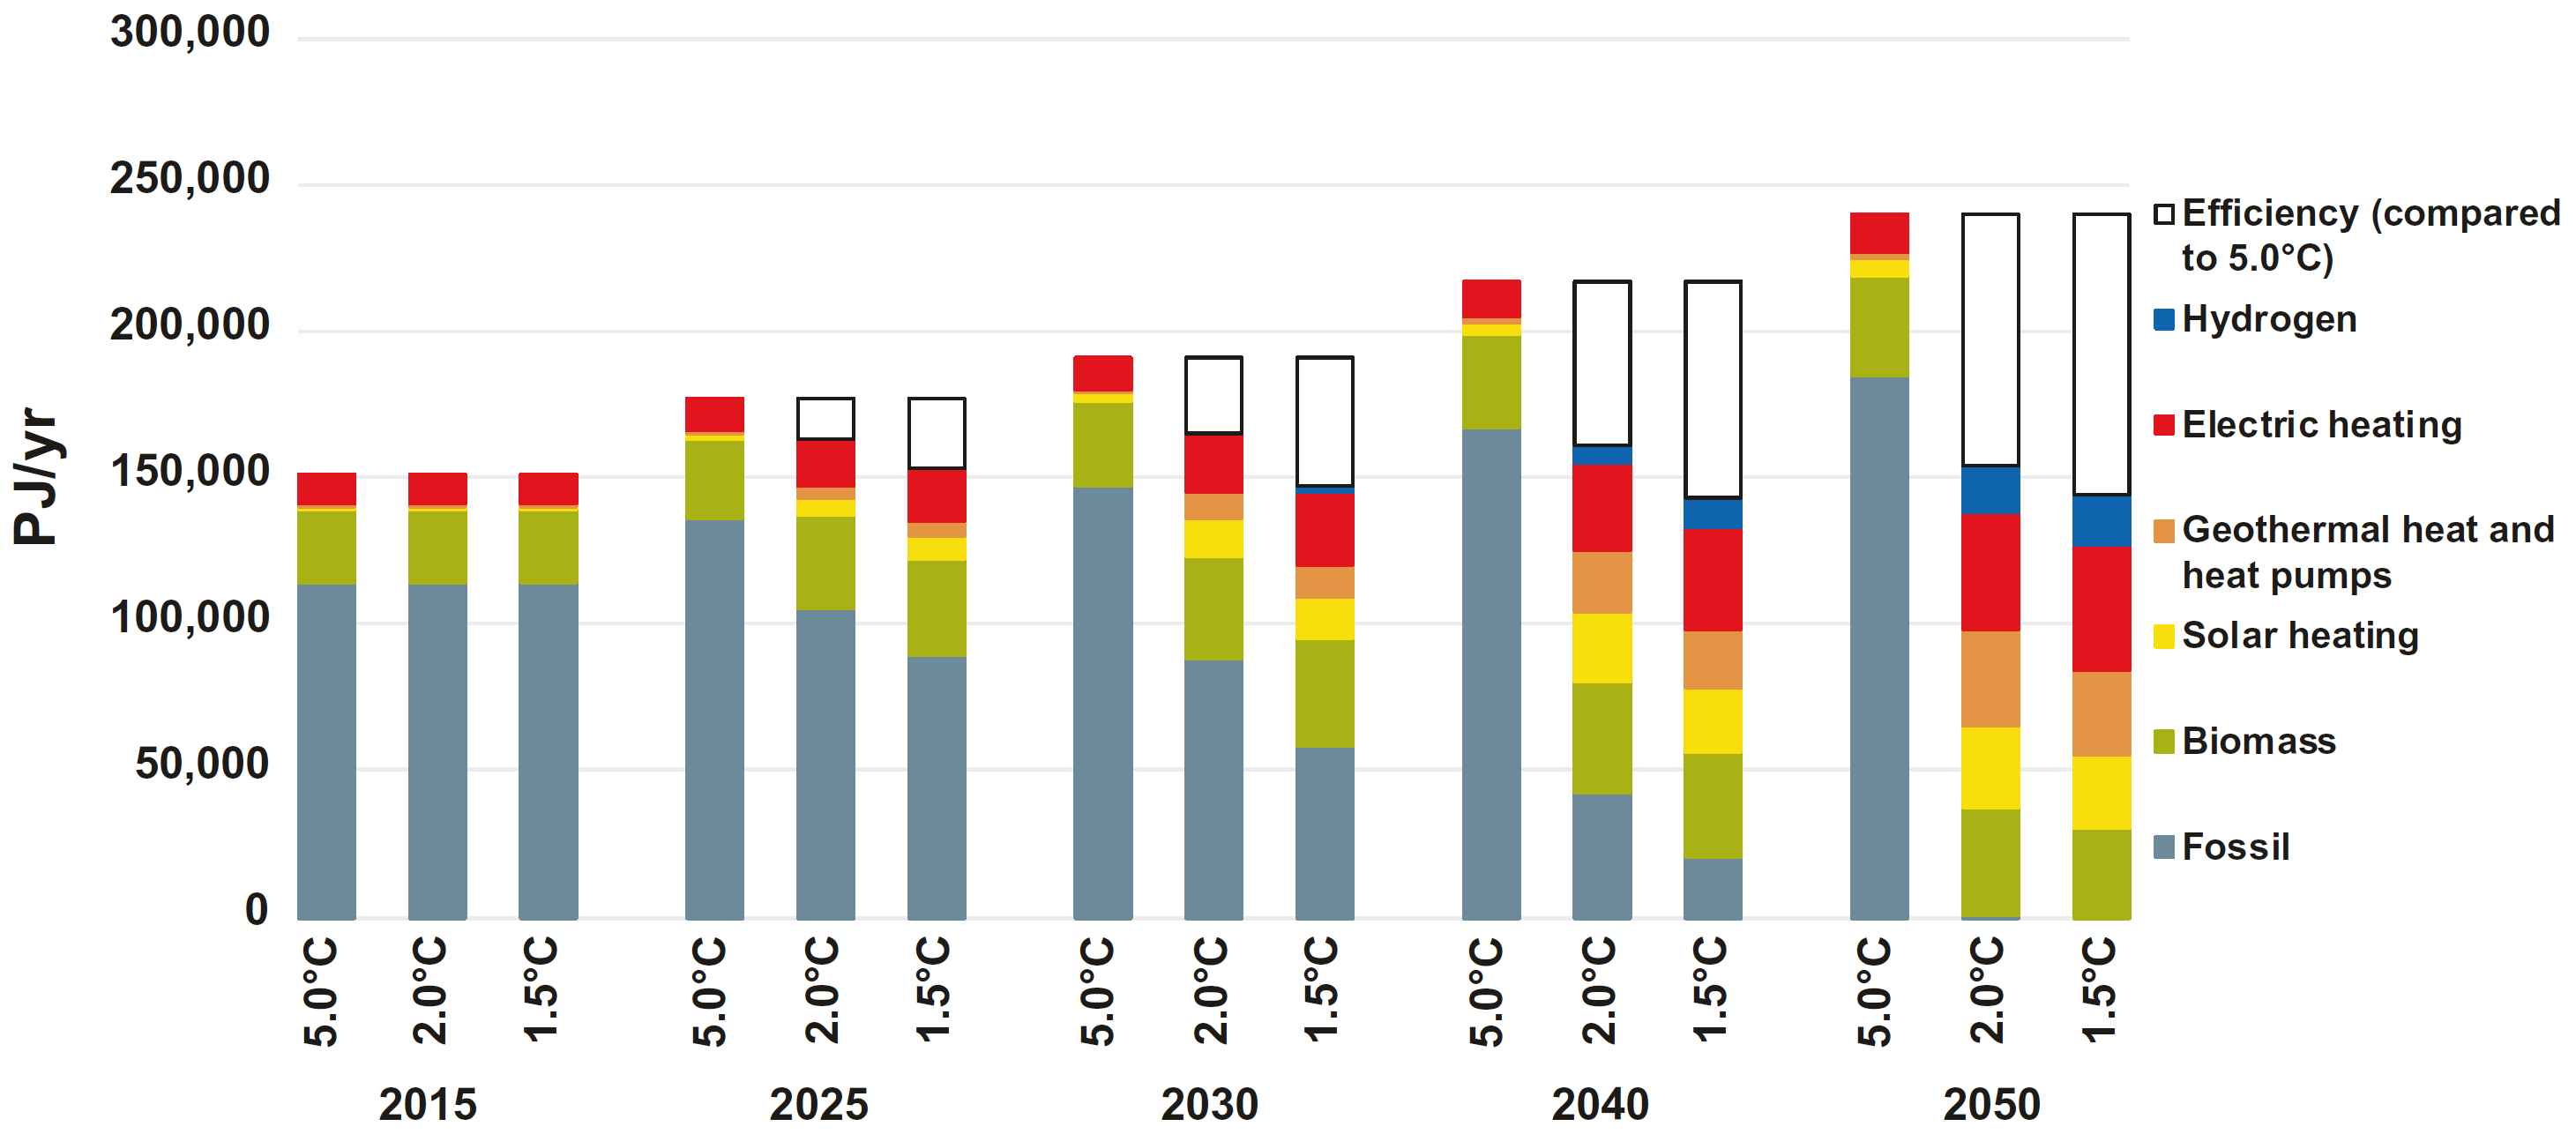
Source: Teske (2019)12, Fig. 8.10
Global final energy consumption by transport in the scenarios
![]()
Source: Teske (2019)12, Fig. 8.12
[This is an early draft of an incomplete article. The figures and tables might be used later]

References:
- Bauer et al (2017) Shared Socio-Economic Pathways of the Energy Sector – Quantifying the Narratives
- Bauer et al (2017) Shared Socio-Economic Pathways of the Energy Sector – Quantifying the Narratives, Supporting online material
- IPCC (2018) Special Report: Global Warming of 1.5°C
- IPCC (2018) Special Report: Global Warming of 1.5°C – Summary for Policymakers
- ‘Global emissions projections to 2100 and the Paris 2015 target’, Climate Action Tracker, accessed online 3rd March 2019
- ‘Global emissions projections to 2030 and emissions gaps to Paris target’, Climate Action Tracker, accessed online 3rd March 2019
- Shell (2018) Shell scenarios. Sky – Meeting the goals of the Paris agreement
- Shell (2018) Shell scenarios. Sky – An overview
- One Earth Climate model, accessed online 18th July 2019
- Paltsev et al (2018) Meeting the Goals of the Paris Agreement: Temperature Implications of the Shell Sky Scenario
- Griscom et al (2017) Natural climate solutions
- Teske (Ed.) (2019) Achieving the Paris Climate Agreement Goals (book) – Global and Regional 100% Renewable Energy Scenarios with Non-energy GHG Pathways for +1.5°C and +2°C
- DNV-GL (2018) Energy Transition Outlook 2018 – A global and regional forcast to 2050
- Davis et al (2018) Net-zero emissions energy systems
- Minx et al (2018) Negative emissions – Part 1 – Research landscape and synthesis
- CarbonBrief (2016) Timeline: How BECCS became climate change’s ‘saviour’ technology
- Anderson & Peters (2016) The trouble with negative emissions (PDF)
- CarbonBrief (2018) World can limit global warming to 1.5C ‘without BECCS’
- van Vuuren et al (2018) Alternative pathways to the 1.5°C target reduce the need for negative emission technologies
- Carbon Brief (2018) World can limit global warming to 1.5C by ‘improving energy efficiency’
- Grubler et al (2018) A low energy demand scenario for meeting the 1.5 °C target and sustainable development goals without negative emission technologies
- Grubler et al (2018) A low energy demand scenario for meeting the 1.5 °C target and sustainable development goals without negative emission technologies – Supplementary information
- ‘A new pathway to Paris’, Shell Climate Change blog by David Hone
- Grubler – Presentation – A Low Energy Demand Scenario for Meeting the 1.5°C Target and Sustainable Development Goals without Negative Emissions (PDF)